
Dependency Graph
Visualize How Your Code Connects
The Dependency Graph renders your codebase as an interactive map of nodes and edges. It answers the questions every developer asks: who uses this type, what does this component rely on, and what breaks if I change it?
Dependencies Graph
The Dependencies Graph renders your codebase as an interactive network of nodes and edges, where nodes represent components (namespaces, classes, or projects) and edges represent dependencies between them. This intuitive visualization makes it easy to understand the overall architecture, identify central hubs, spot unwanted dependencies, and communicate structure to stakeholders. The graph is fully interactive: you can zoom, pan, drill down, and highlight specific dependency paths.
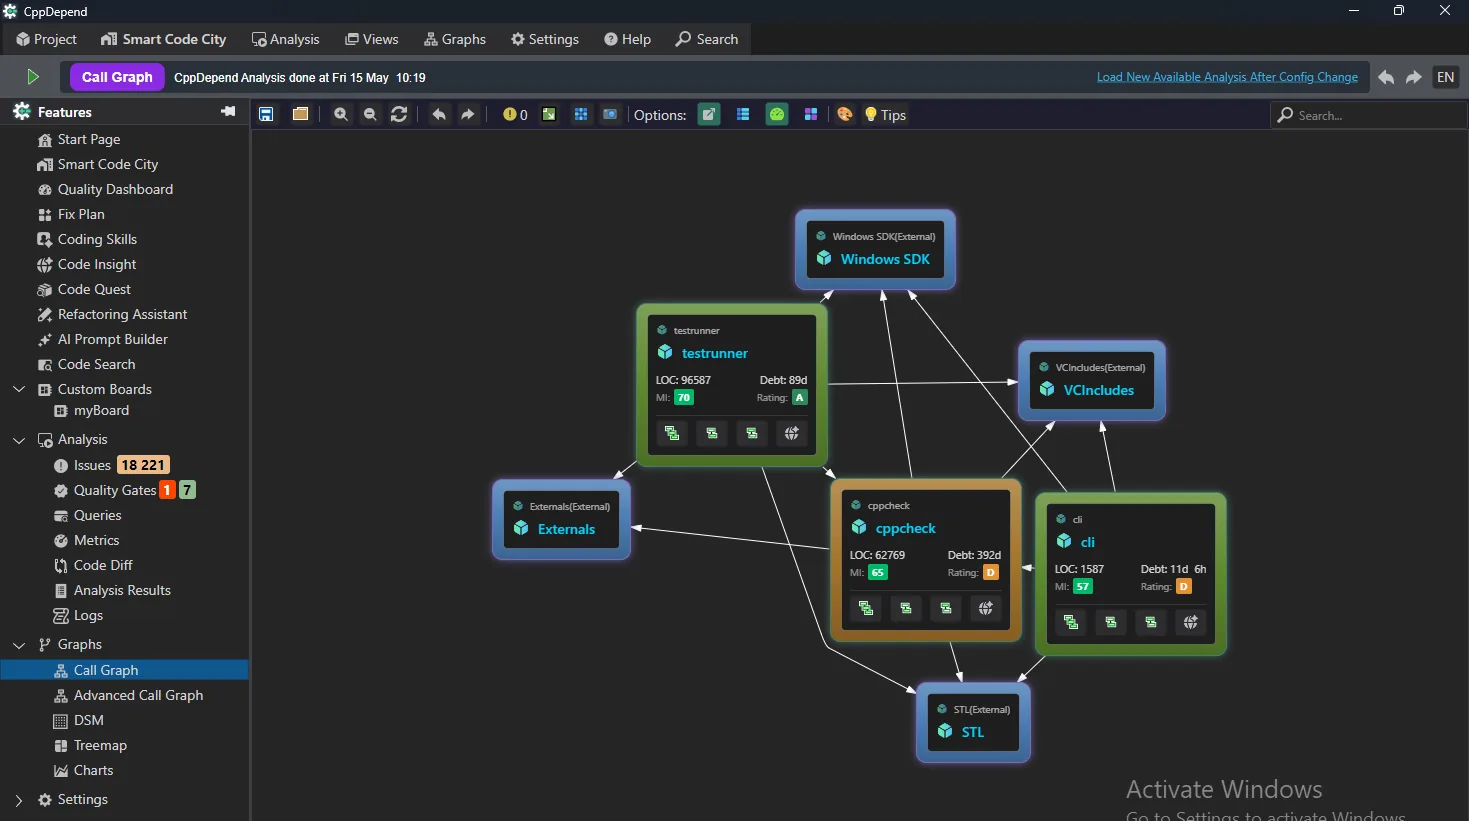
Impact Analysis
Before refactoring, select any element and instantly see its direct and transitive callers and callees. The graph turns risky blind changes into informed, surgical modifications.
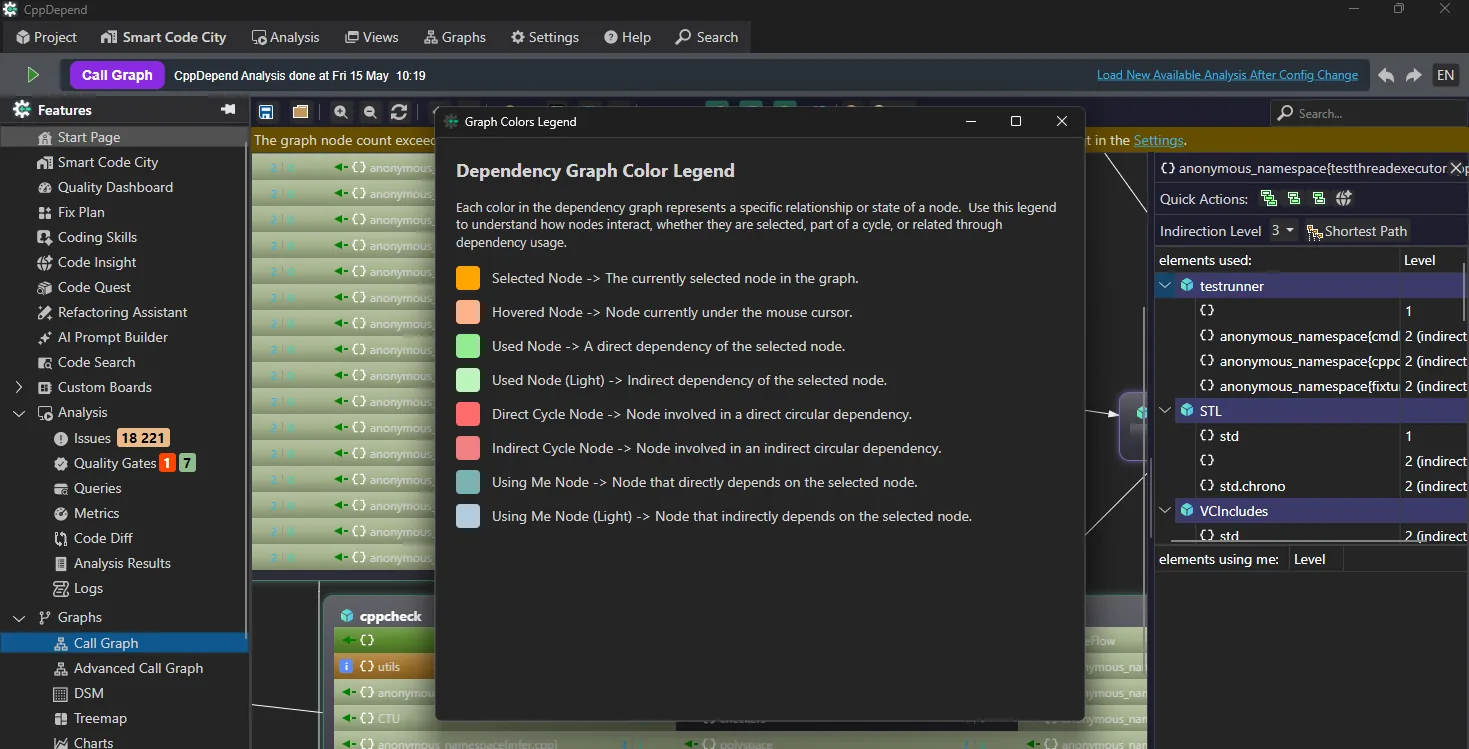
Color-Coded Dependencies
Every color has a meaning: selected, used, using-me, direct and indirect cycle nodes. The built-in legend makes even dense graphs readable in seconds.
Graphs at Any Scale
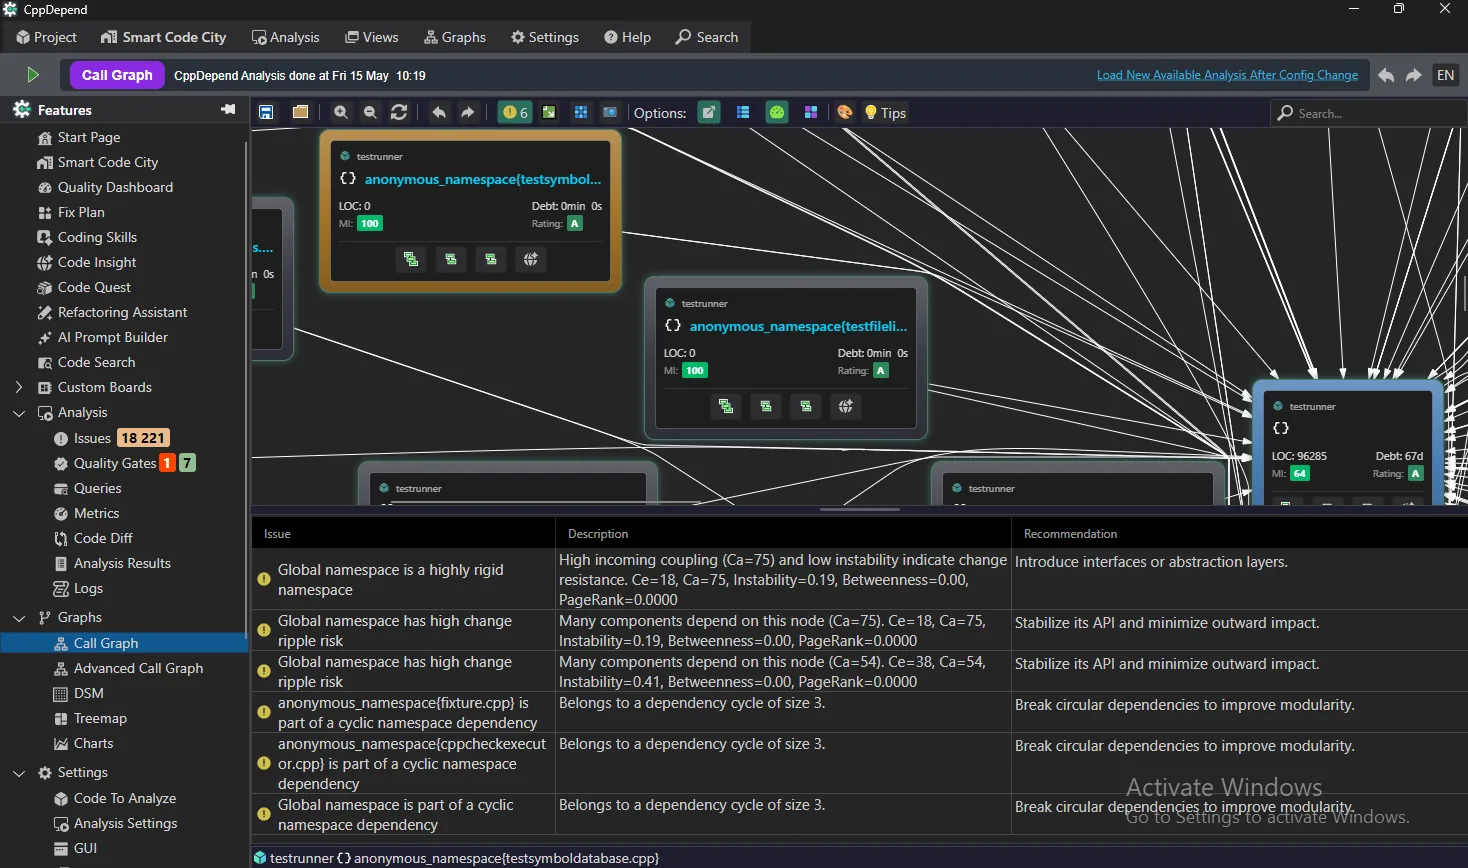
Generate graphs for the whole application, a set of projects, a namespace subtree or a single method’s call graph. Filtering and progressive expansion keep even million-line codebases readable.
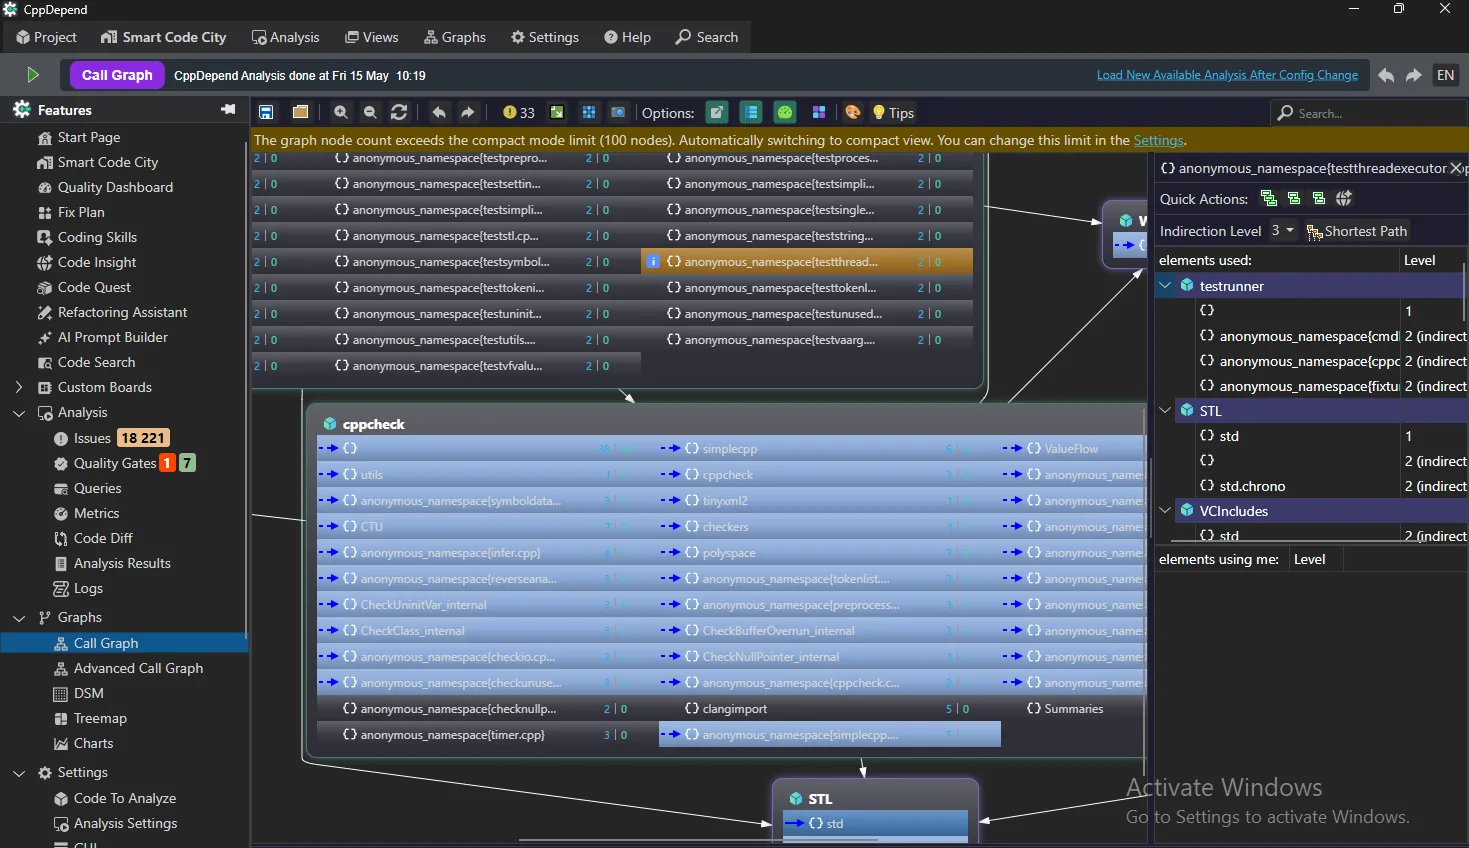
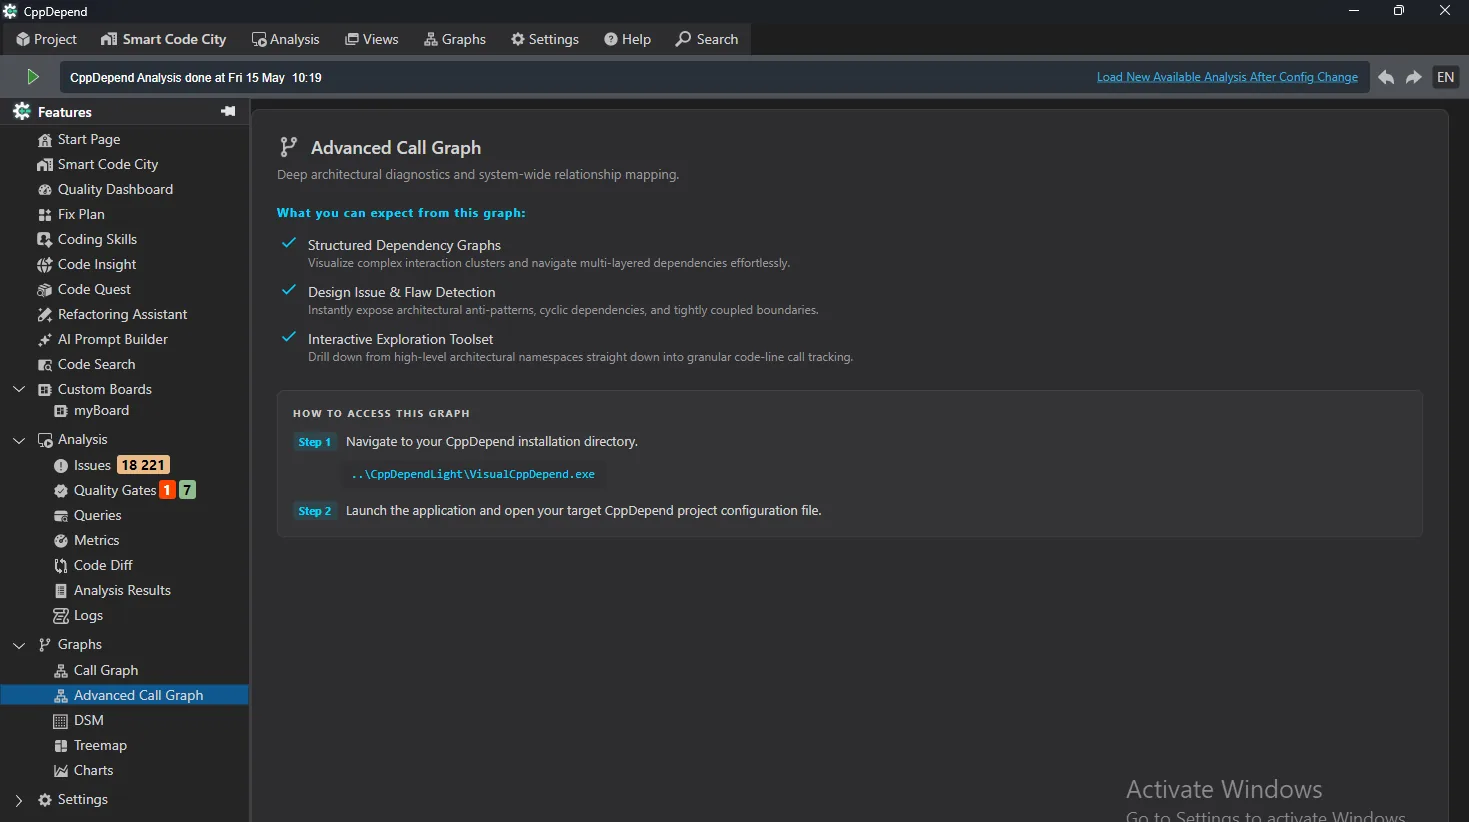
Advanced Call Graph
For deep architectural diagnostics, the Advanced Call Graph maps system-wide relationships, exposes anti-patterns and cyclic dependencies, and drills down to code-line call tracking.
Try Dependency Graph with CppDepend
Start your 14-day free trial with full access to all features. No credit card required.