
Treemap
See Your Whole Codebase at a Glance
The treemap gives you an instant, bird’s-eye view of your entire codebase. Every element — project, namespace, type or method — is drawn as a rectangle whose size and color encode the metrics you choose, so hotspots stand out immediately.
Treemap Metric
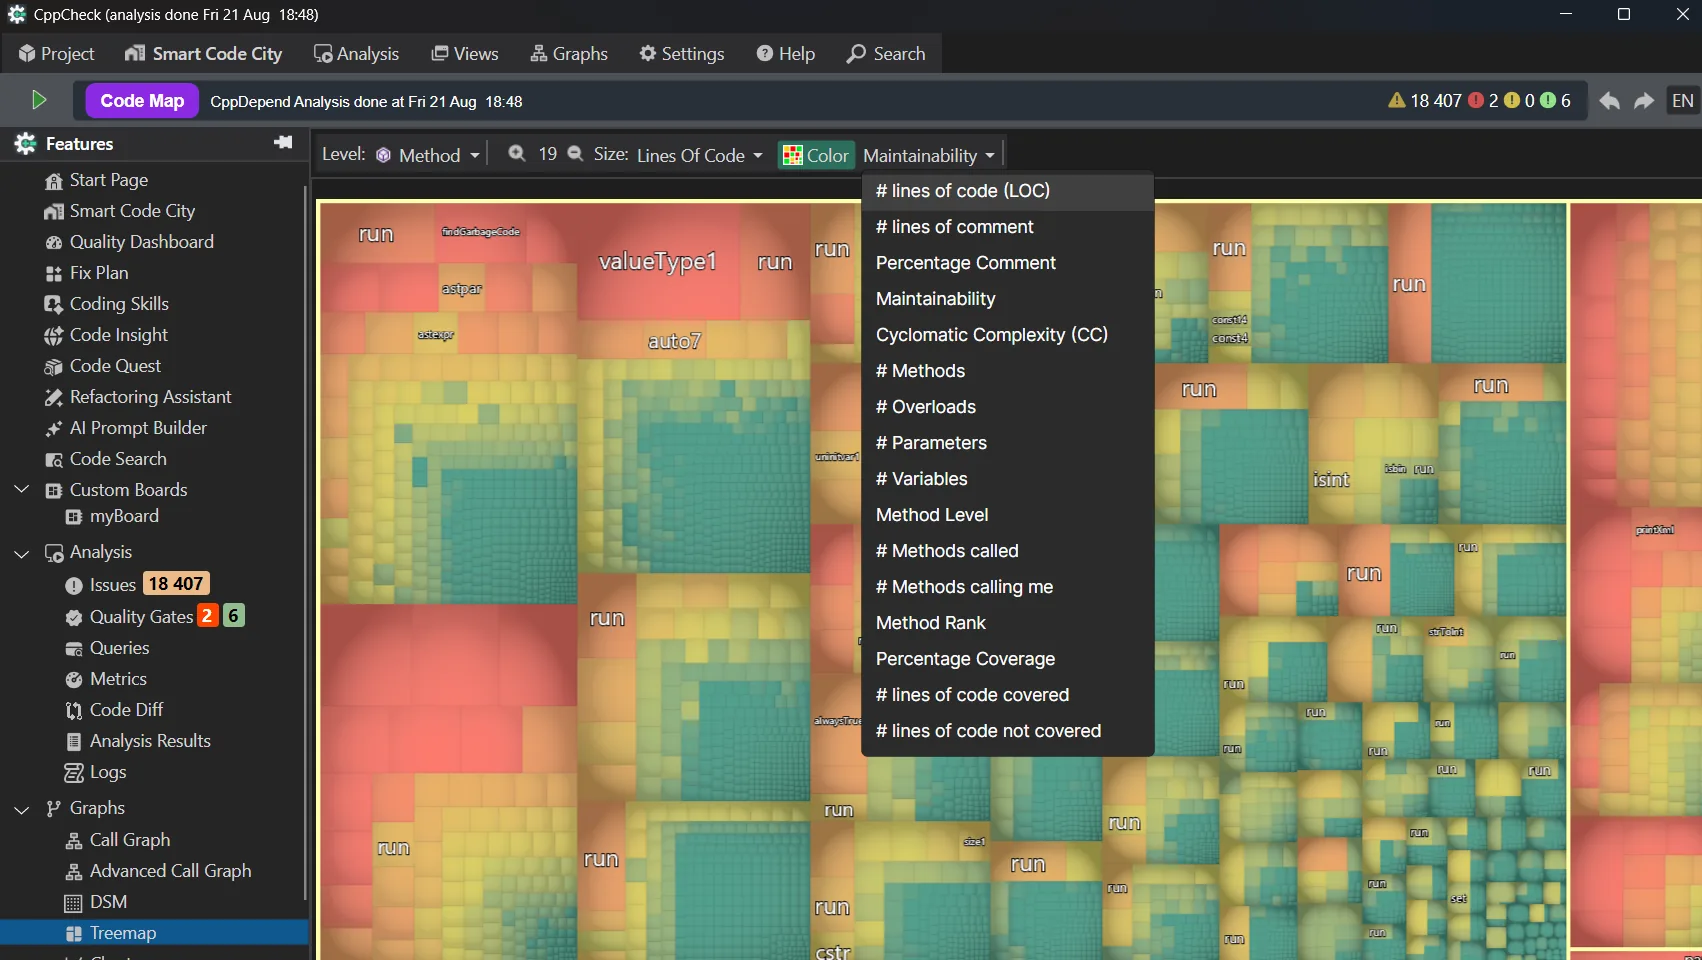
The Treemap Metric provides a hierarchical visualization of your codebase using nested rectangles. Each rectangle represents a component (namespace, class, or method), with size and color encoding different metric values such as lines of code, cyclomatic complexity, or code coverage. This makes it easy to spot hotspots and outliers at a glance. Large, brightly colored blocks immediately draw attention to areas that need investigation.
Drill Down into Hotspots
Double-click any rectangle to zoom into a namespace or type and inspect its children. Combined with the metric color scale, you can go from a full-application overview to the exact method responsible for a complexity hotspot in seconds.
Choose Your Metrics
Rectangle size can represent lines of code, number of methods, cyclomatic complexity or coverage, while color can map to issues, debt rating or change frequency. Switching metric pairs reveals different facets of the same codebase without running a new analysis.
Zoom at Any Level
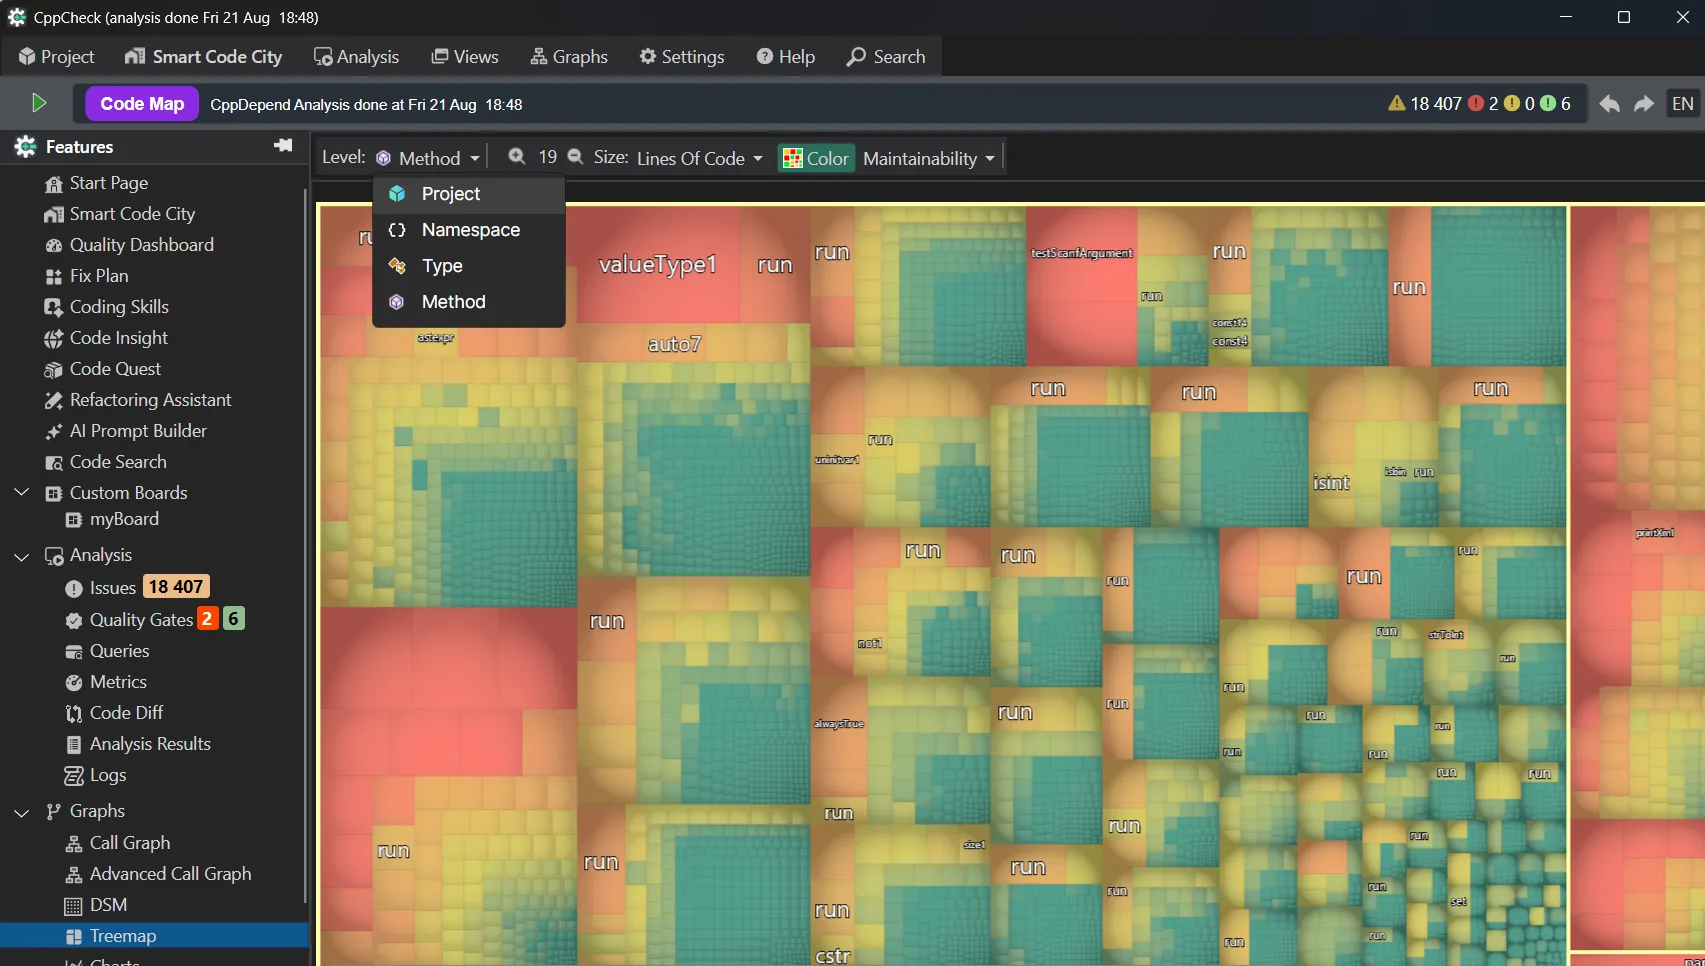
Explore your codebase at the granularity you need: switch the treemap level between Project, Namespace, Type and Method to reveal structure from the big picture down to individual methods.
Size by Any Metric
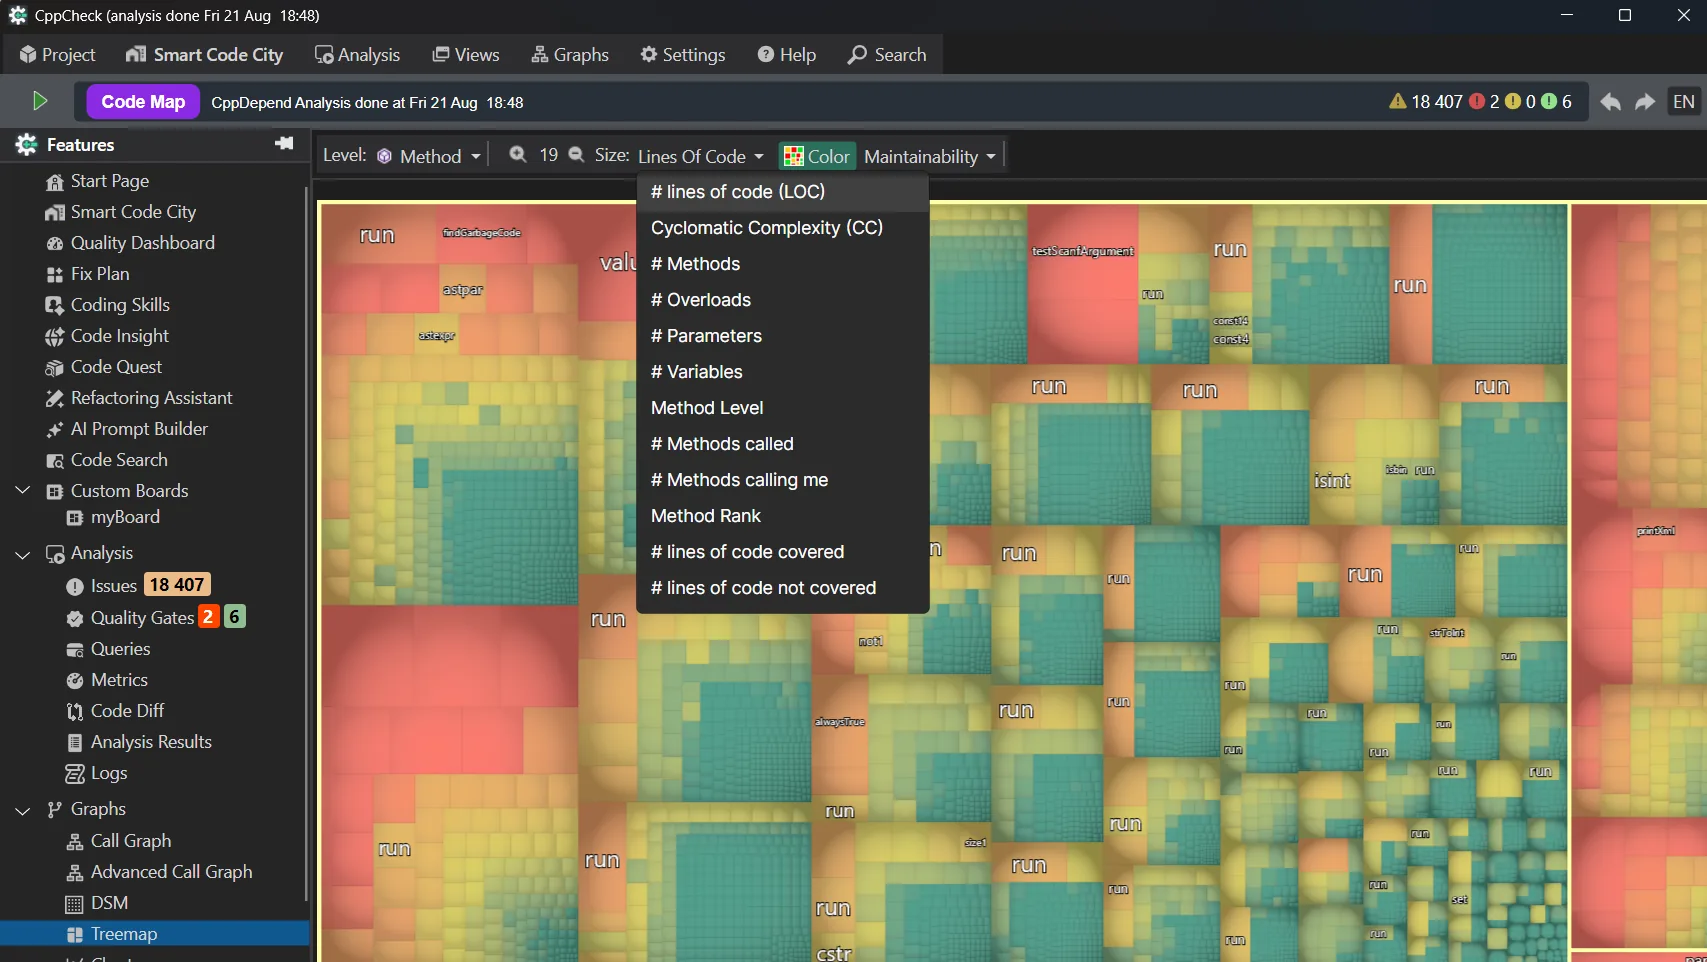
Choose what each rectangle's size represents: lines of code, cyclomatic complexity, number of methods, parameters, variables, methods called, coverage and more — the treemap instantly reshapes to expose what matters to you.
Try Treemap with CppDepend
Start your 14-day free trial with full access to all features. No credit card required.