

Master the Dependency Graph
Use these tips to explore dependencies efficiently, understand relationships, and navigate large graphs with confidence.
The Dependency Graph has been fully redesigned in CppDepend 2026.1 to provide a more interactive,
intuitive, and powerful experience when exploring code architecture.
This new version introduces improved navigation, enhanced filtering capabilities, better visualization of dependencies,
and new options to analyze relationships between code elements more efficiently.
The Dependency Graph in CppDepend helps you visualize relationships between namespaces, types, methods, and other code elements. It makes complex architecture easier to understand and helps you quickly identify coupling, cycles, risky dependencies, and hidden structure.
The sections below explain the main interactions available in the graph and illustrate them with practical examples.
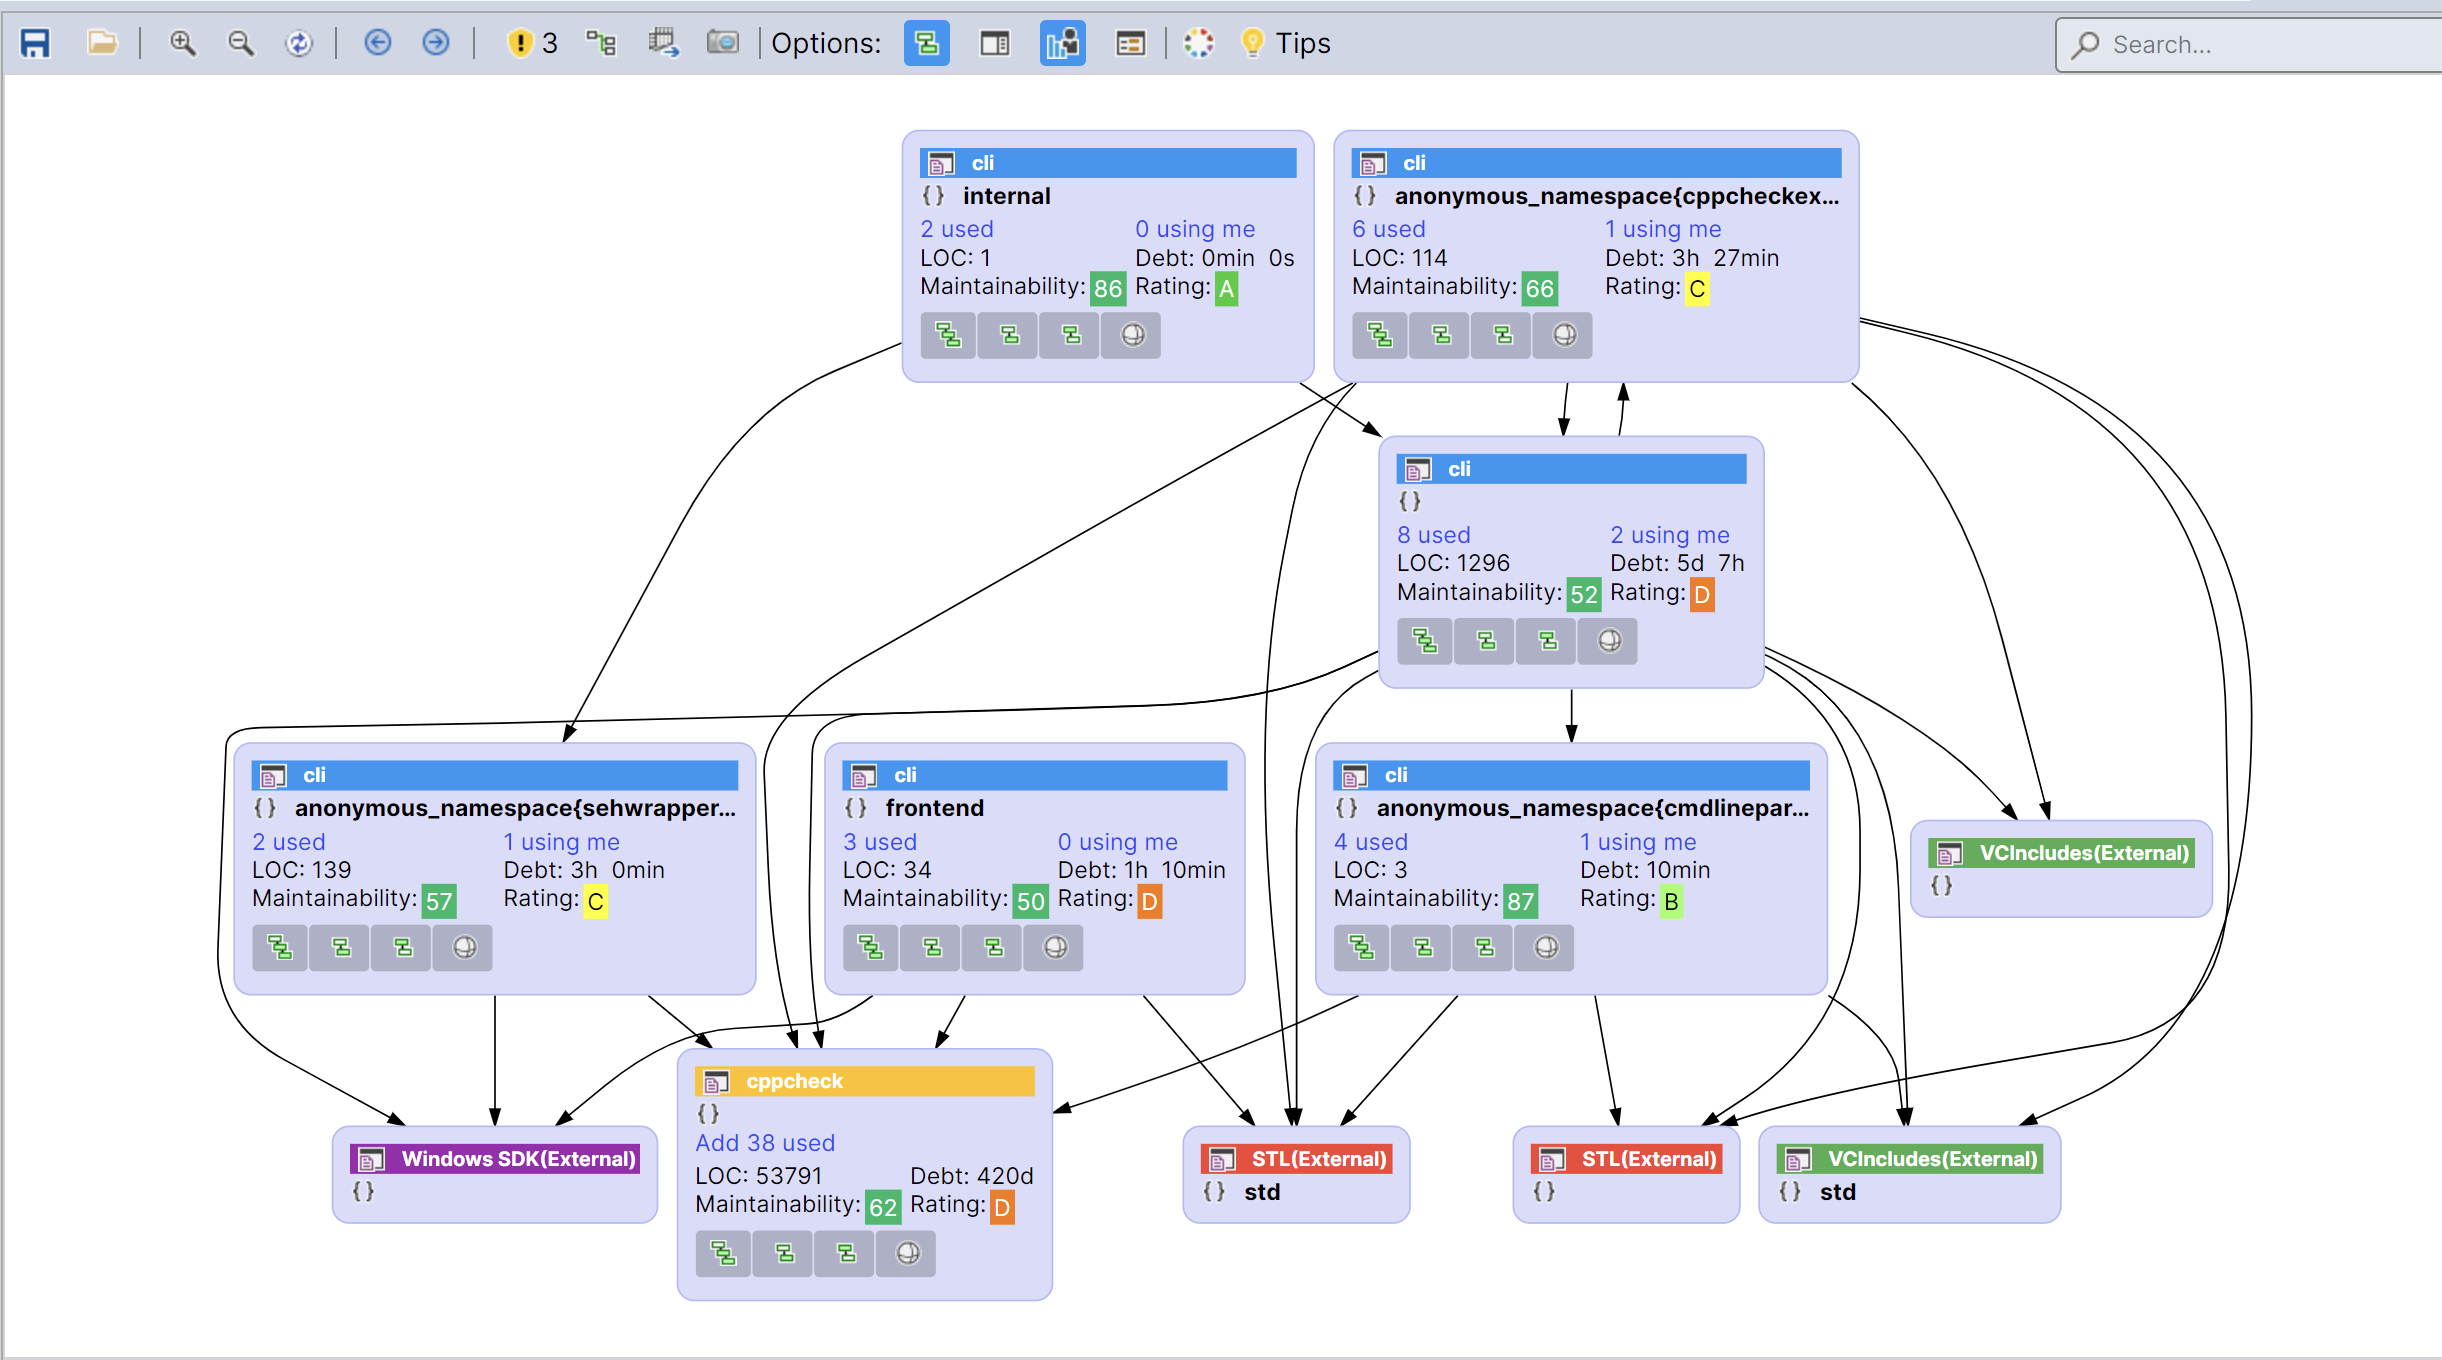
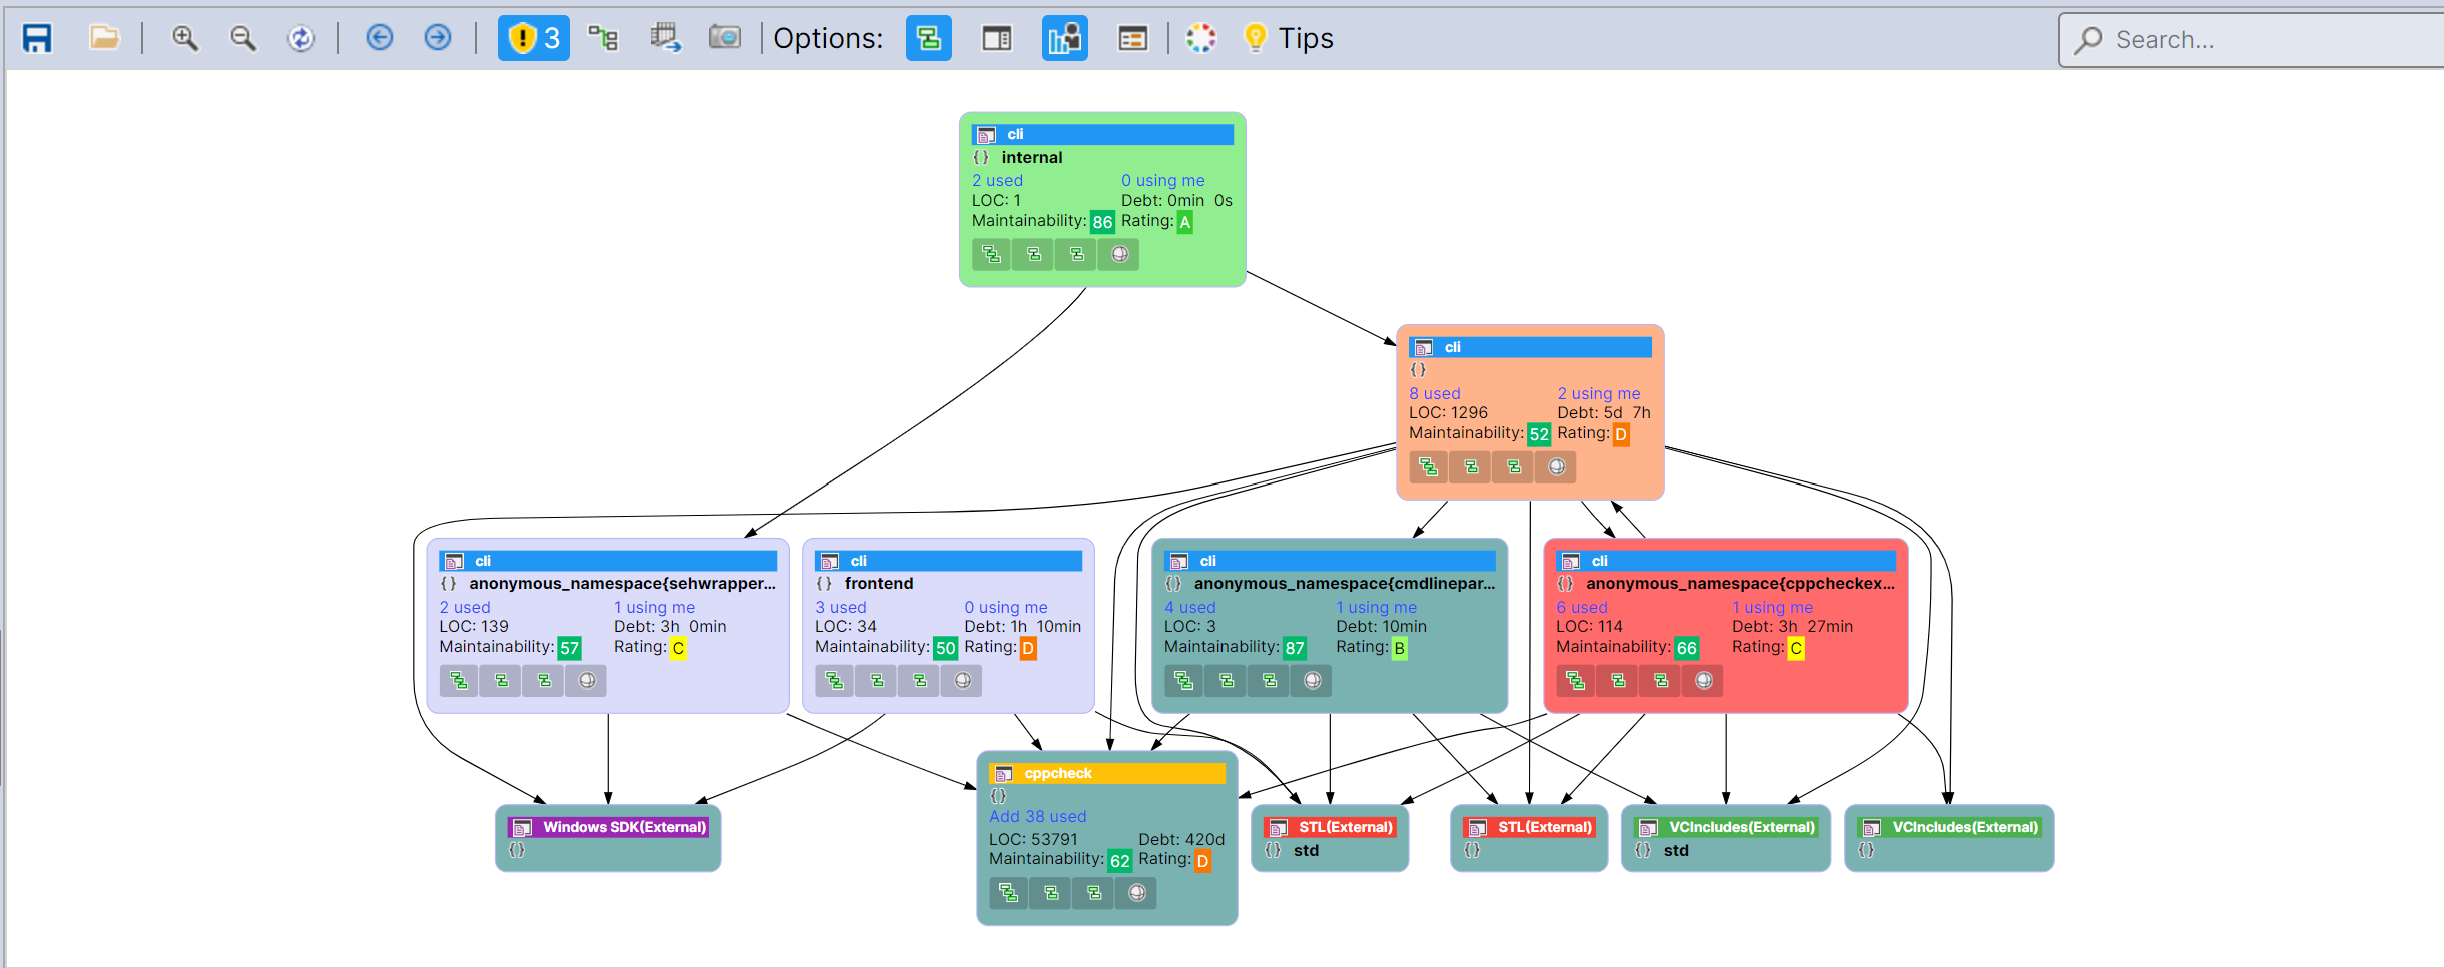
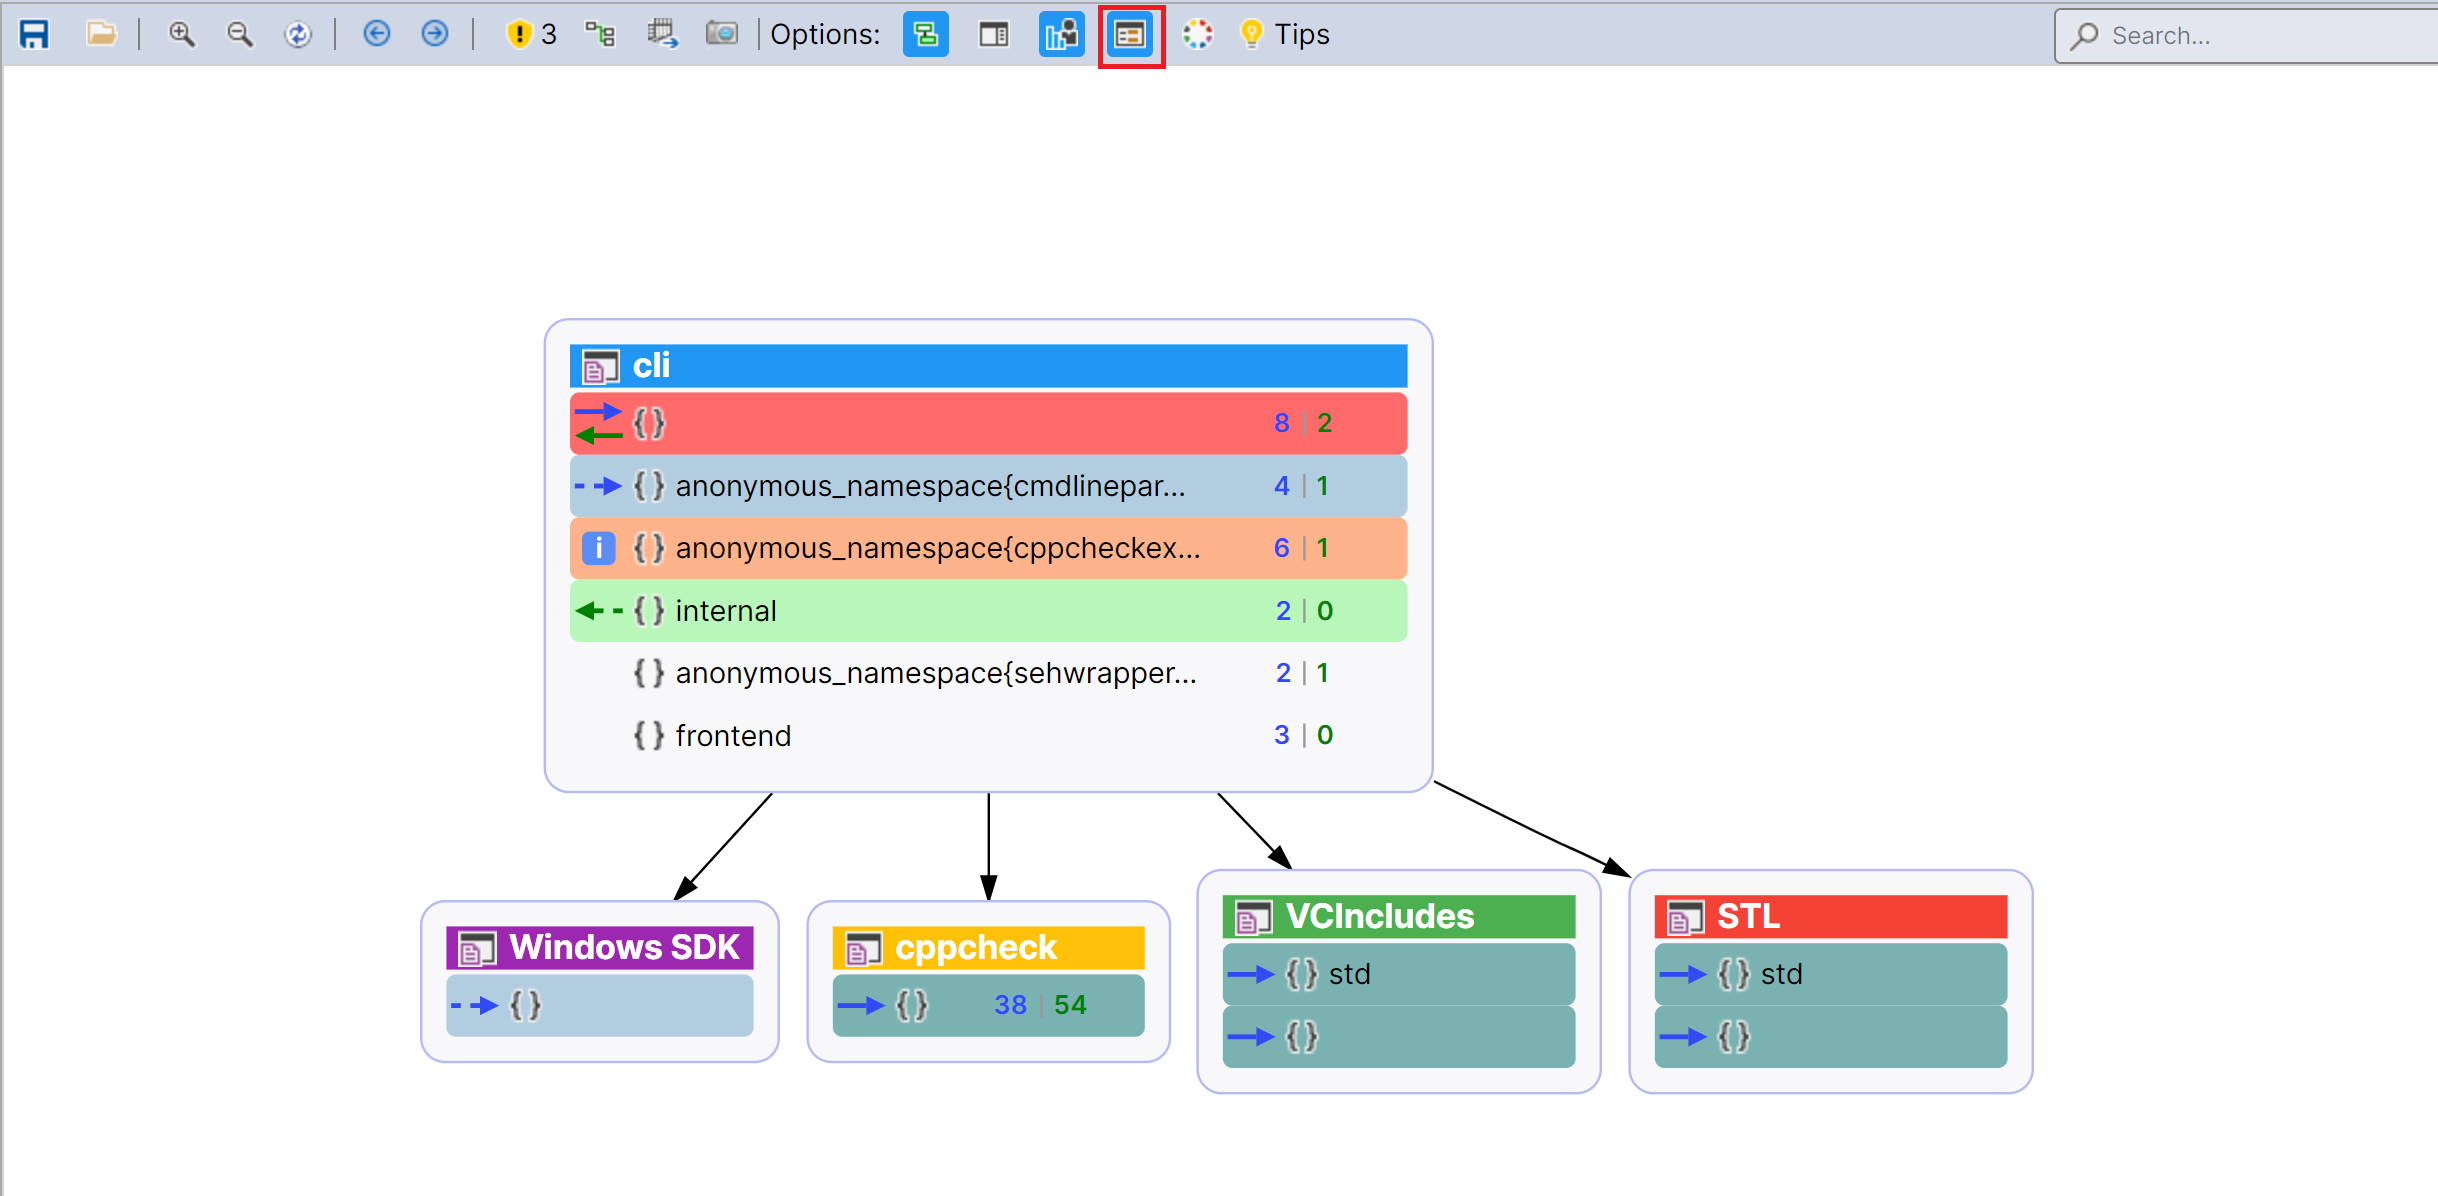
Double Click to Drill Down
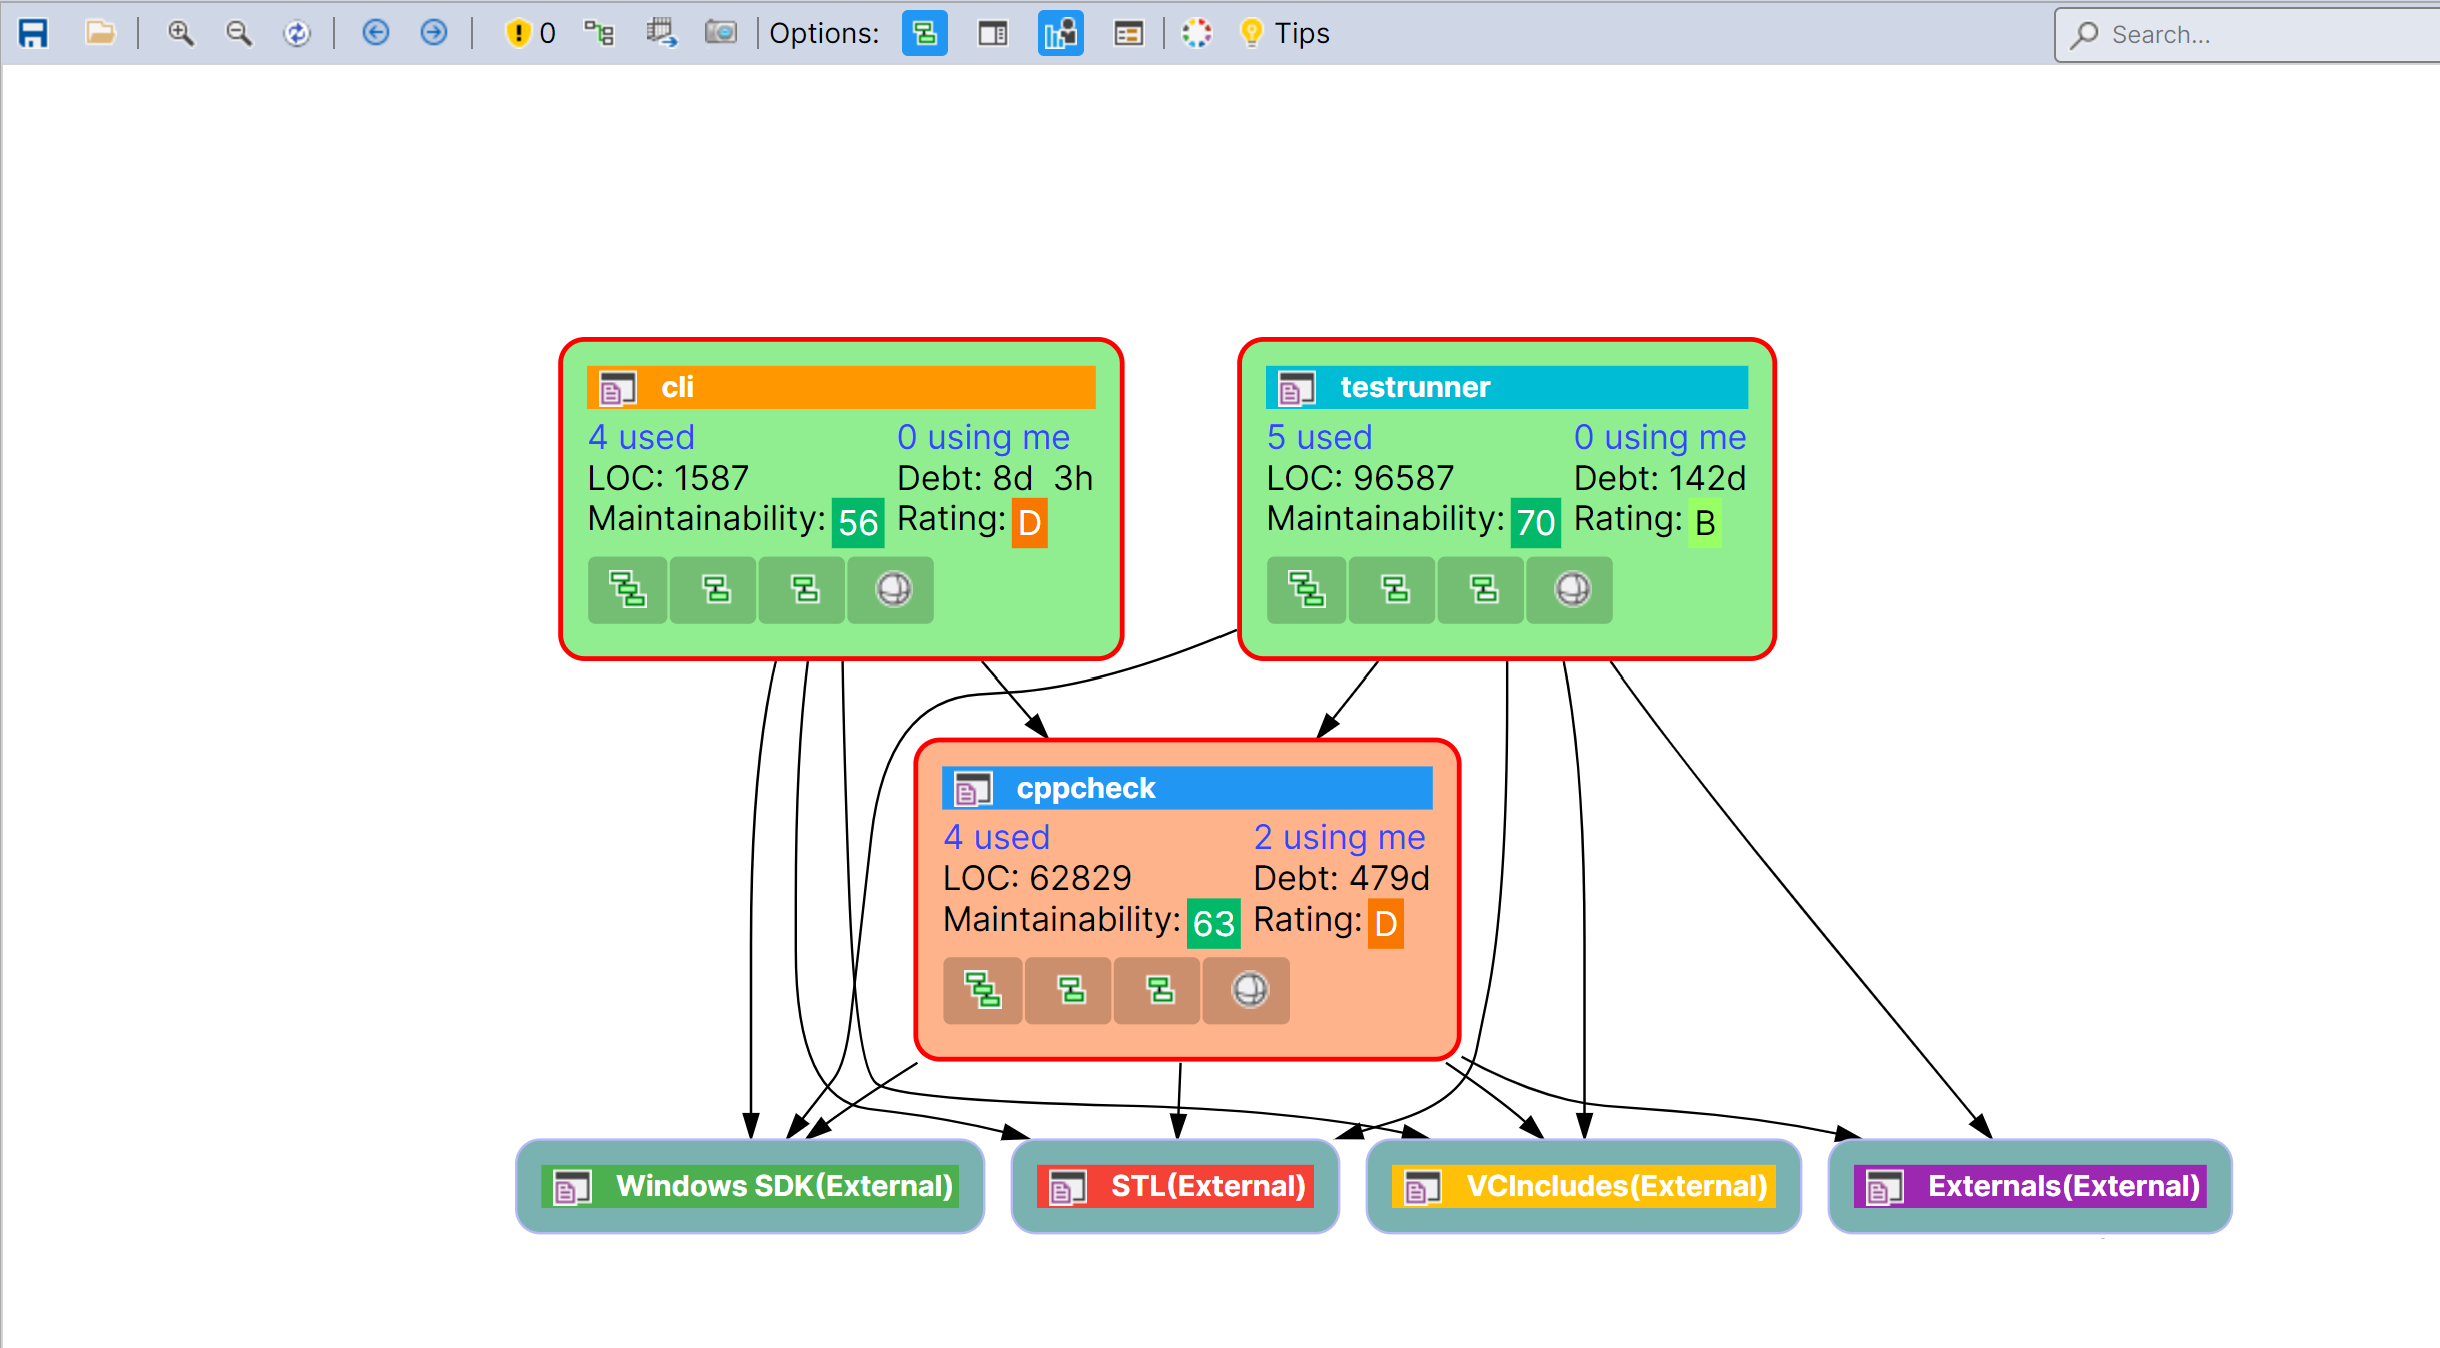
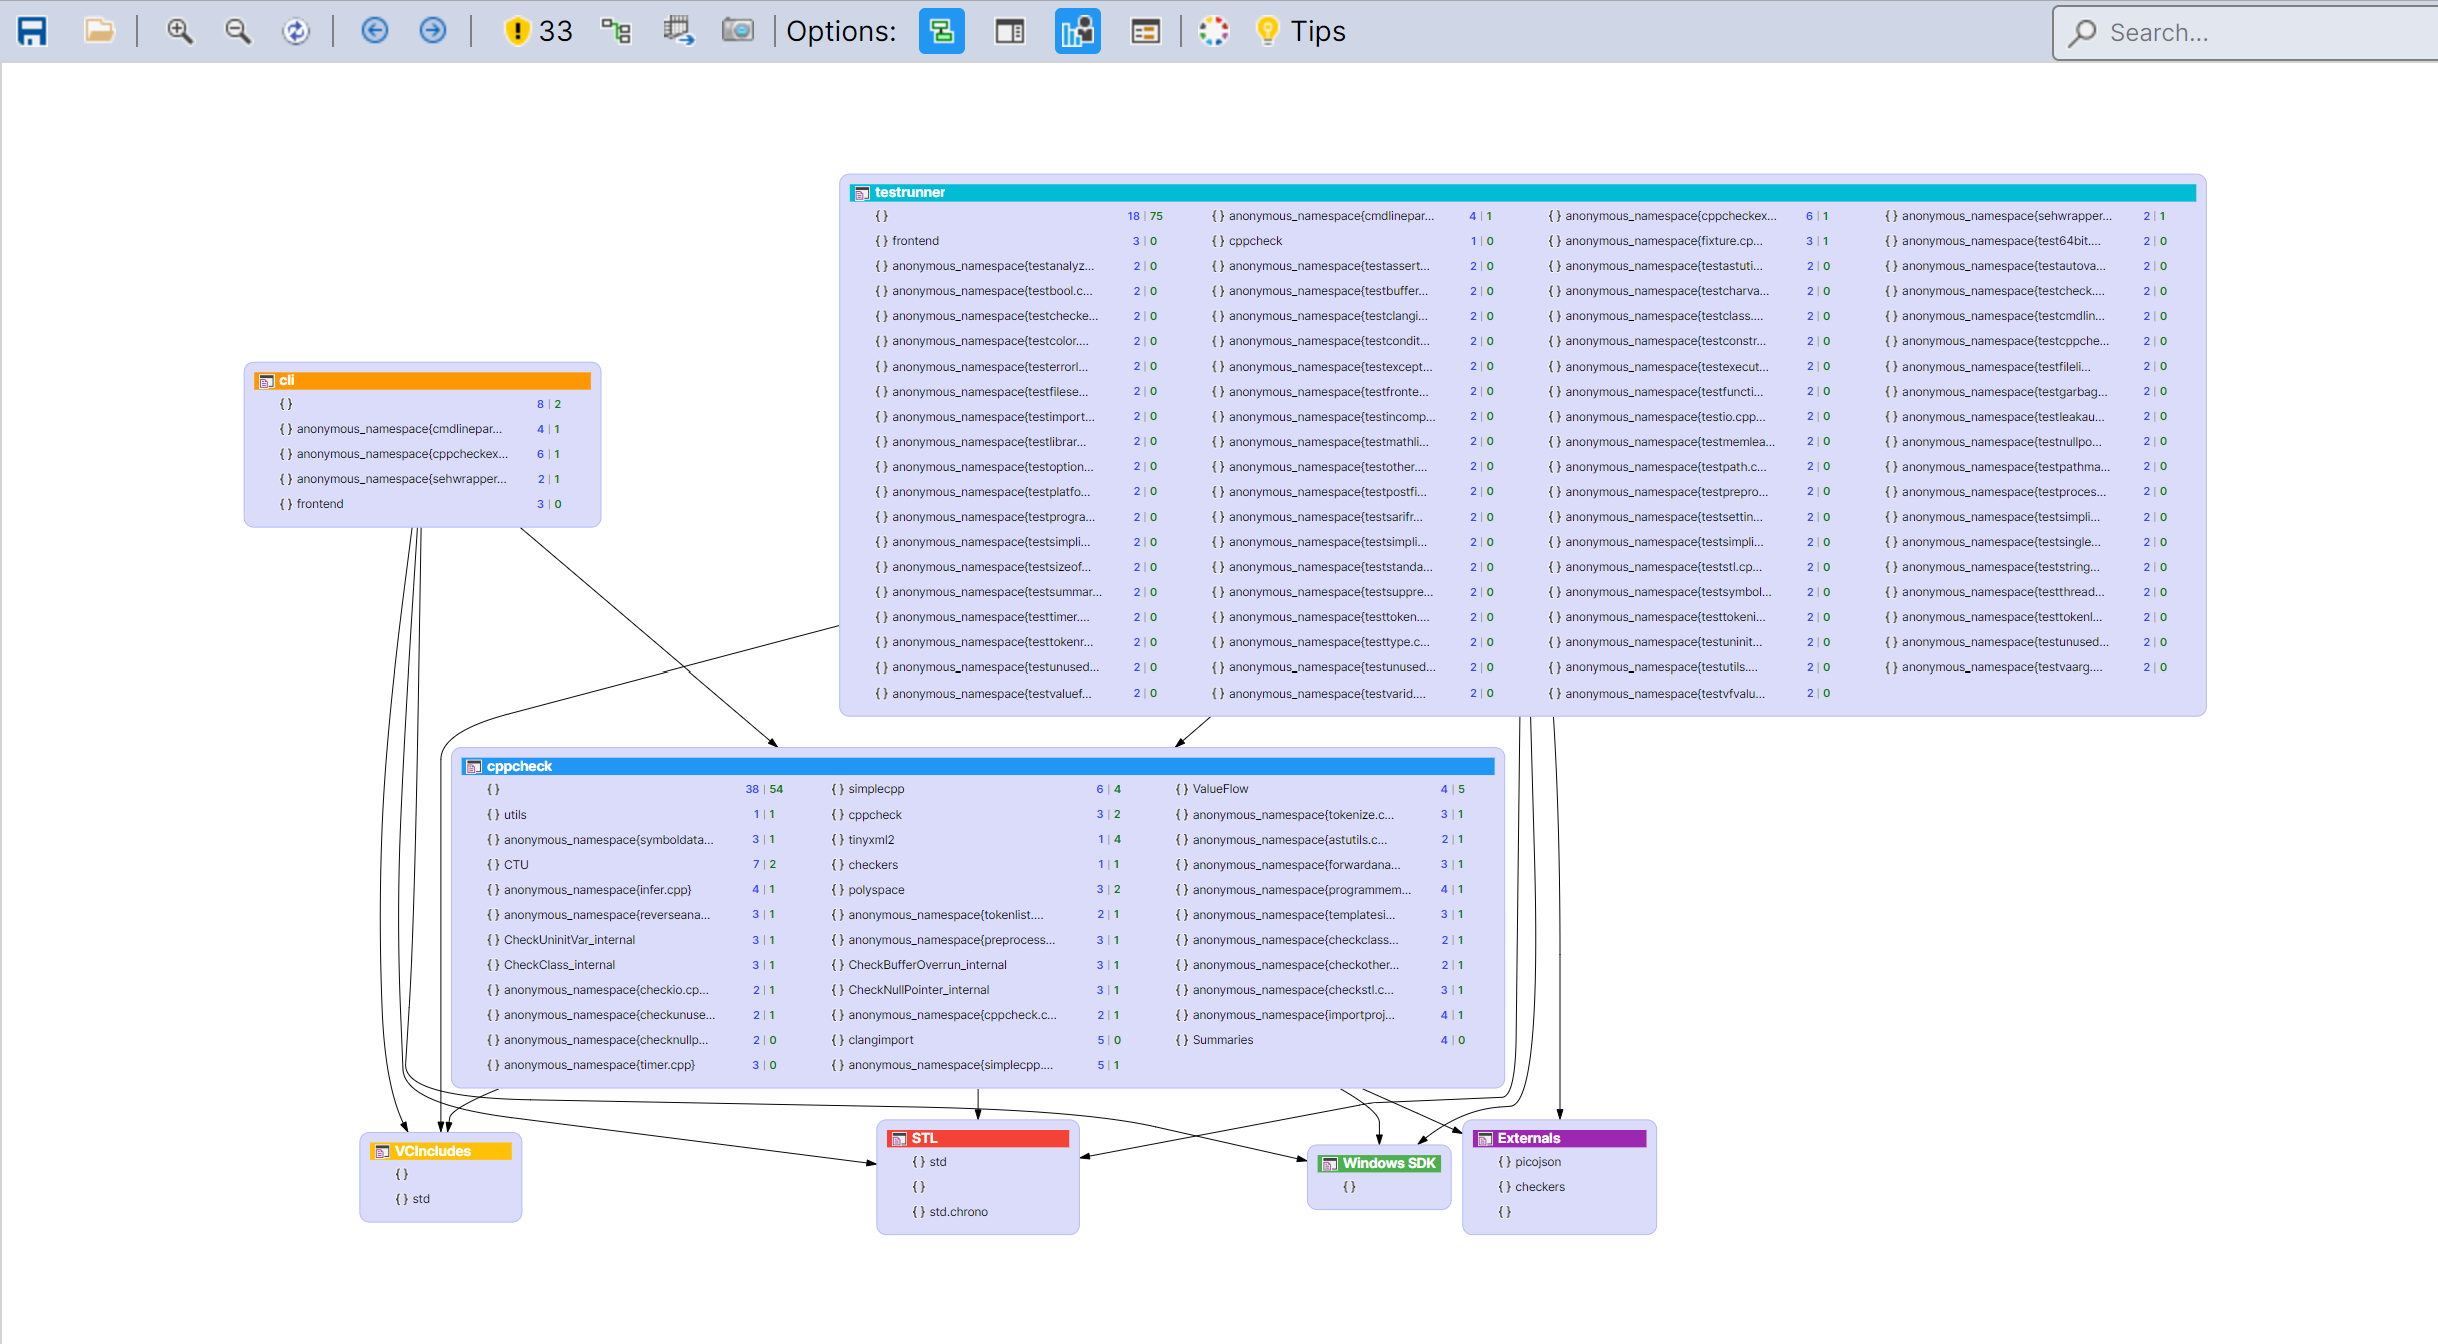
The graph can first be viewed at a high level to understand the major components and their relationships.
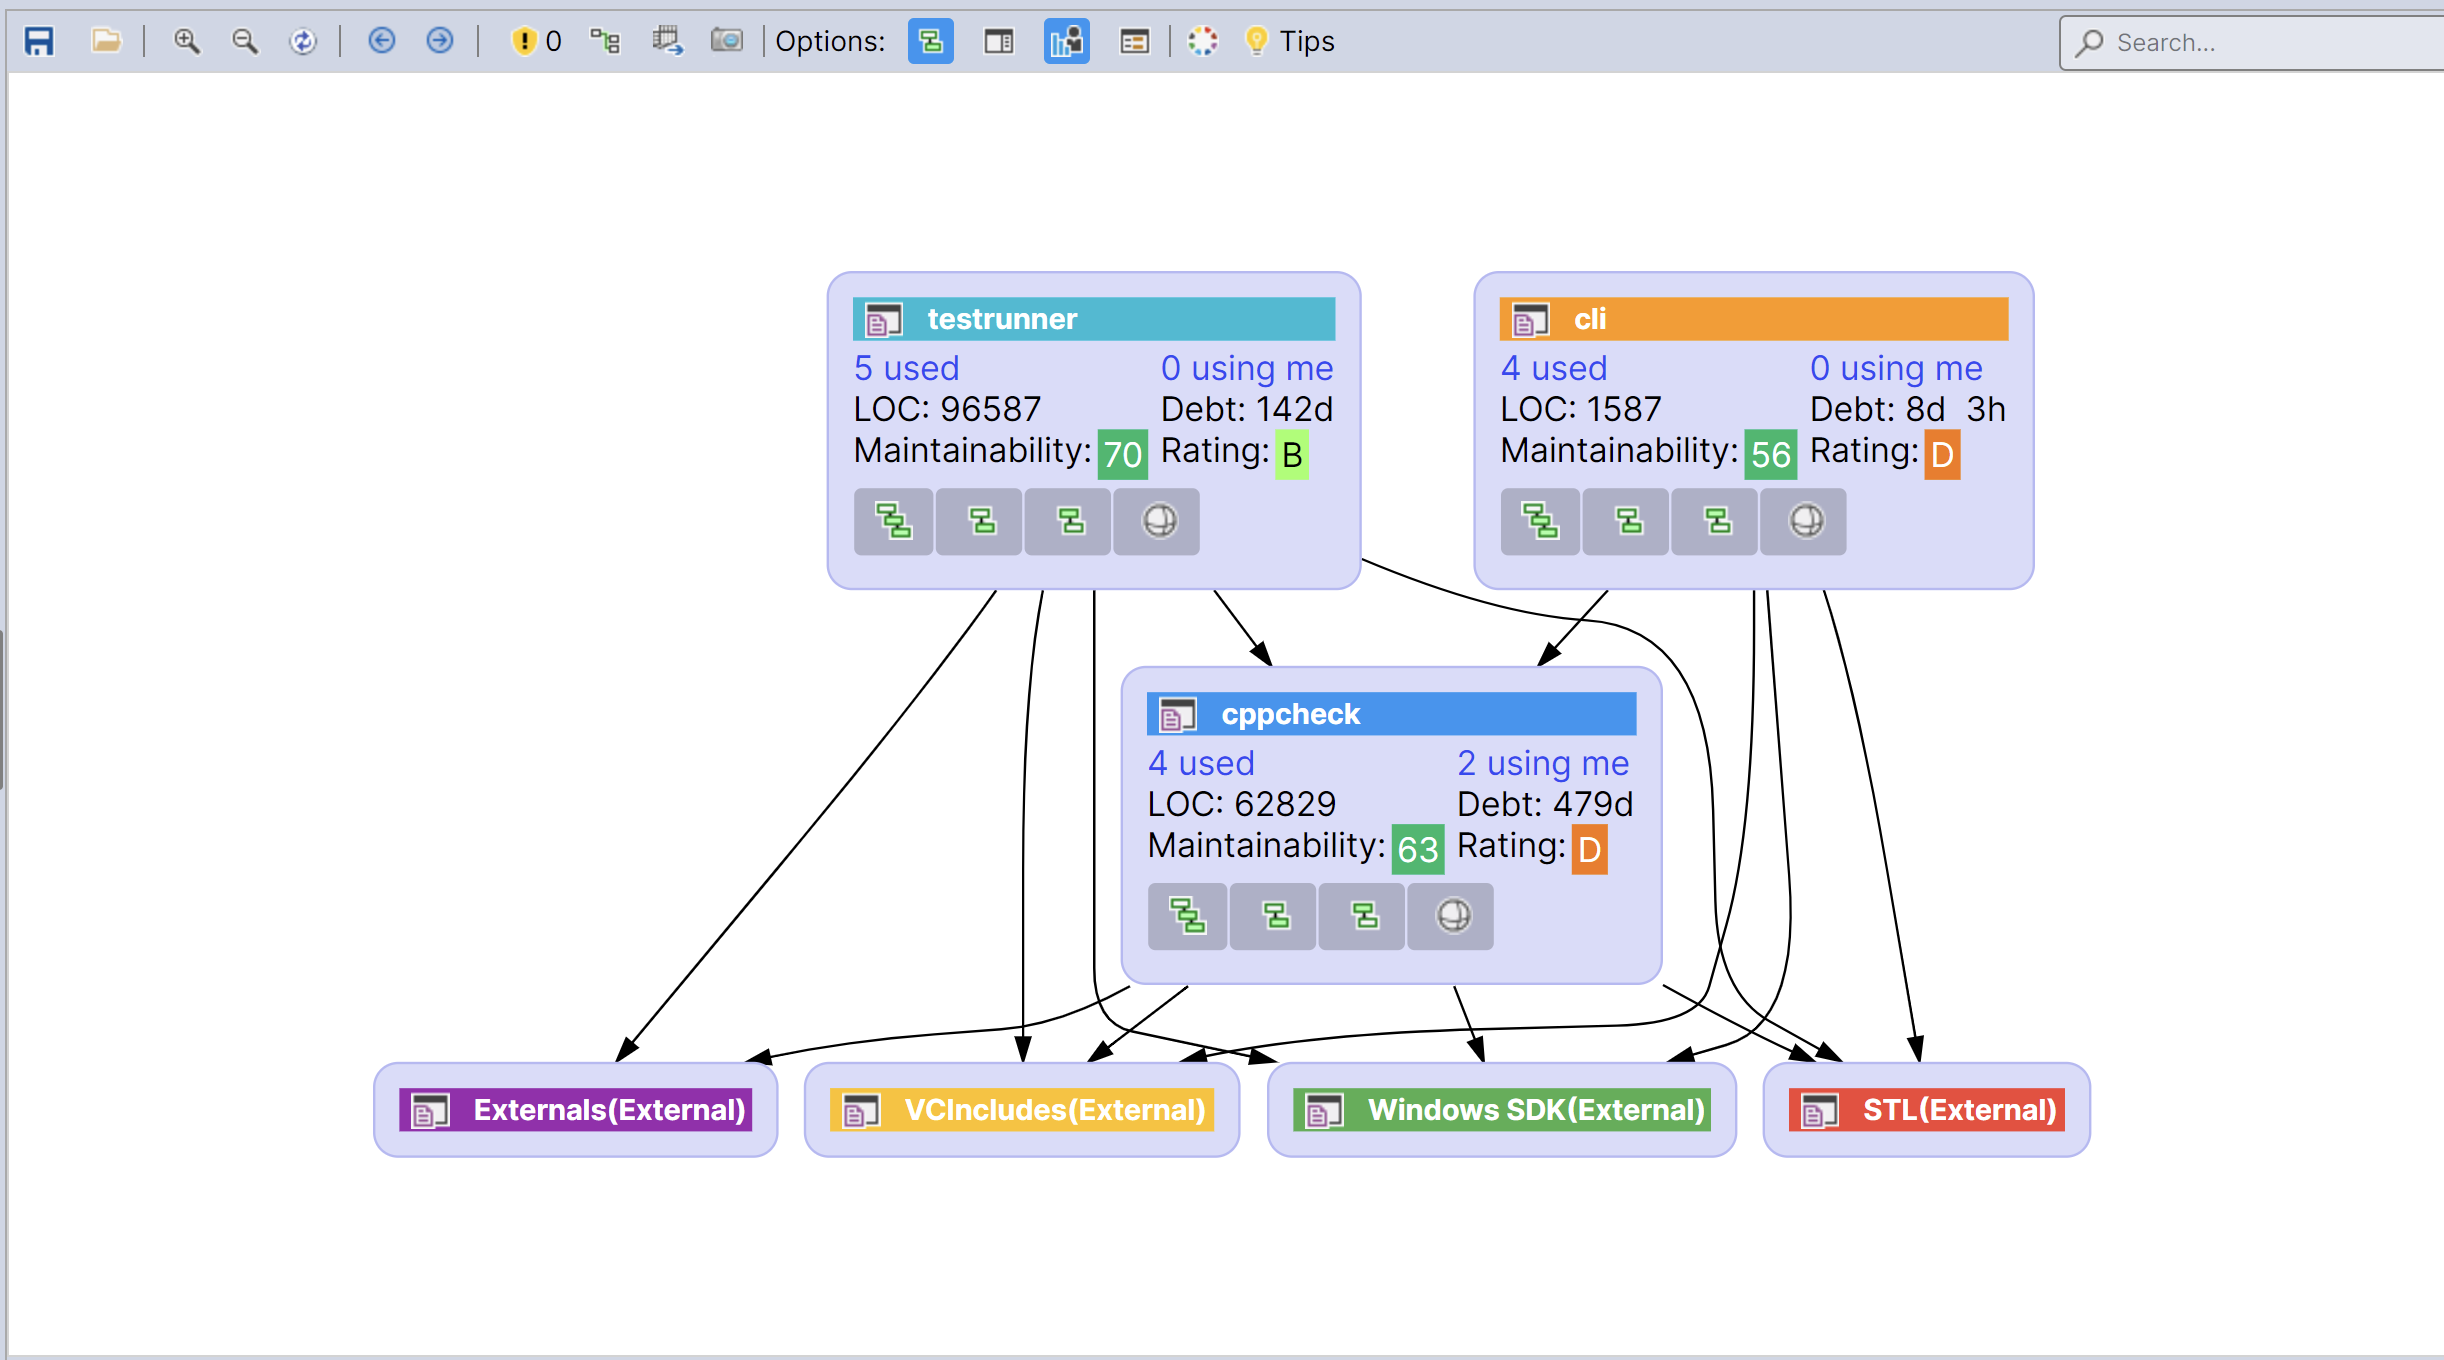
When you want to inspect one specific element in more detail, double click its node. CppDepend then drills down
into that element and displays a more focused graph of its internal structure and direct dependencies,
as shown below.
Multi-Selection with Ctrl
In a large graph, you may want to focus on a few important nodes while still keeping the surrounding dependency context.
The graph below illustrates 2 nodes selected (highlighted with Red) while holding Ctrl.
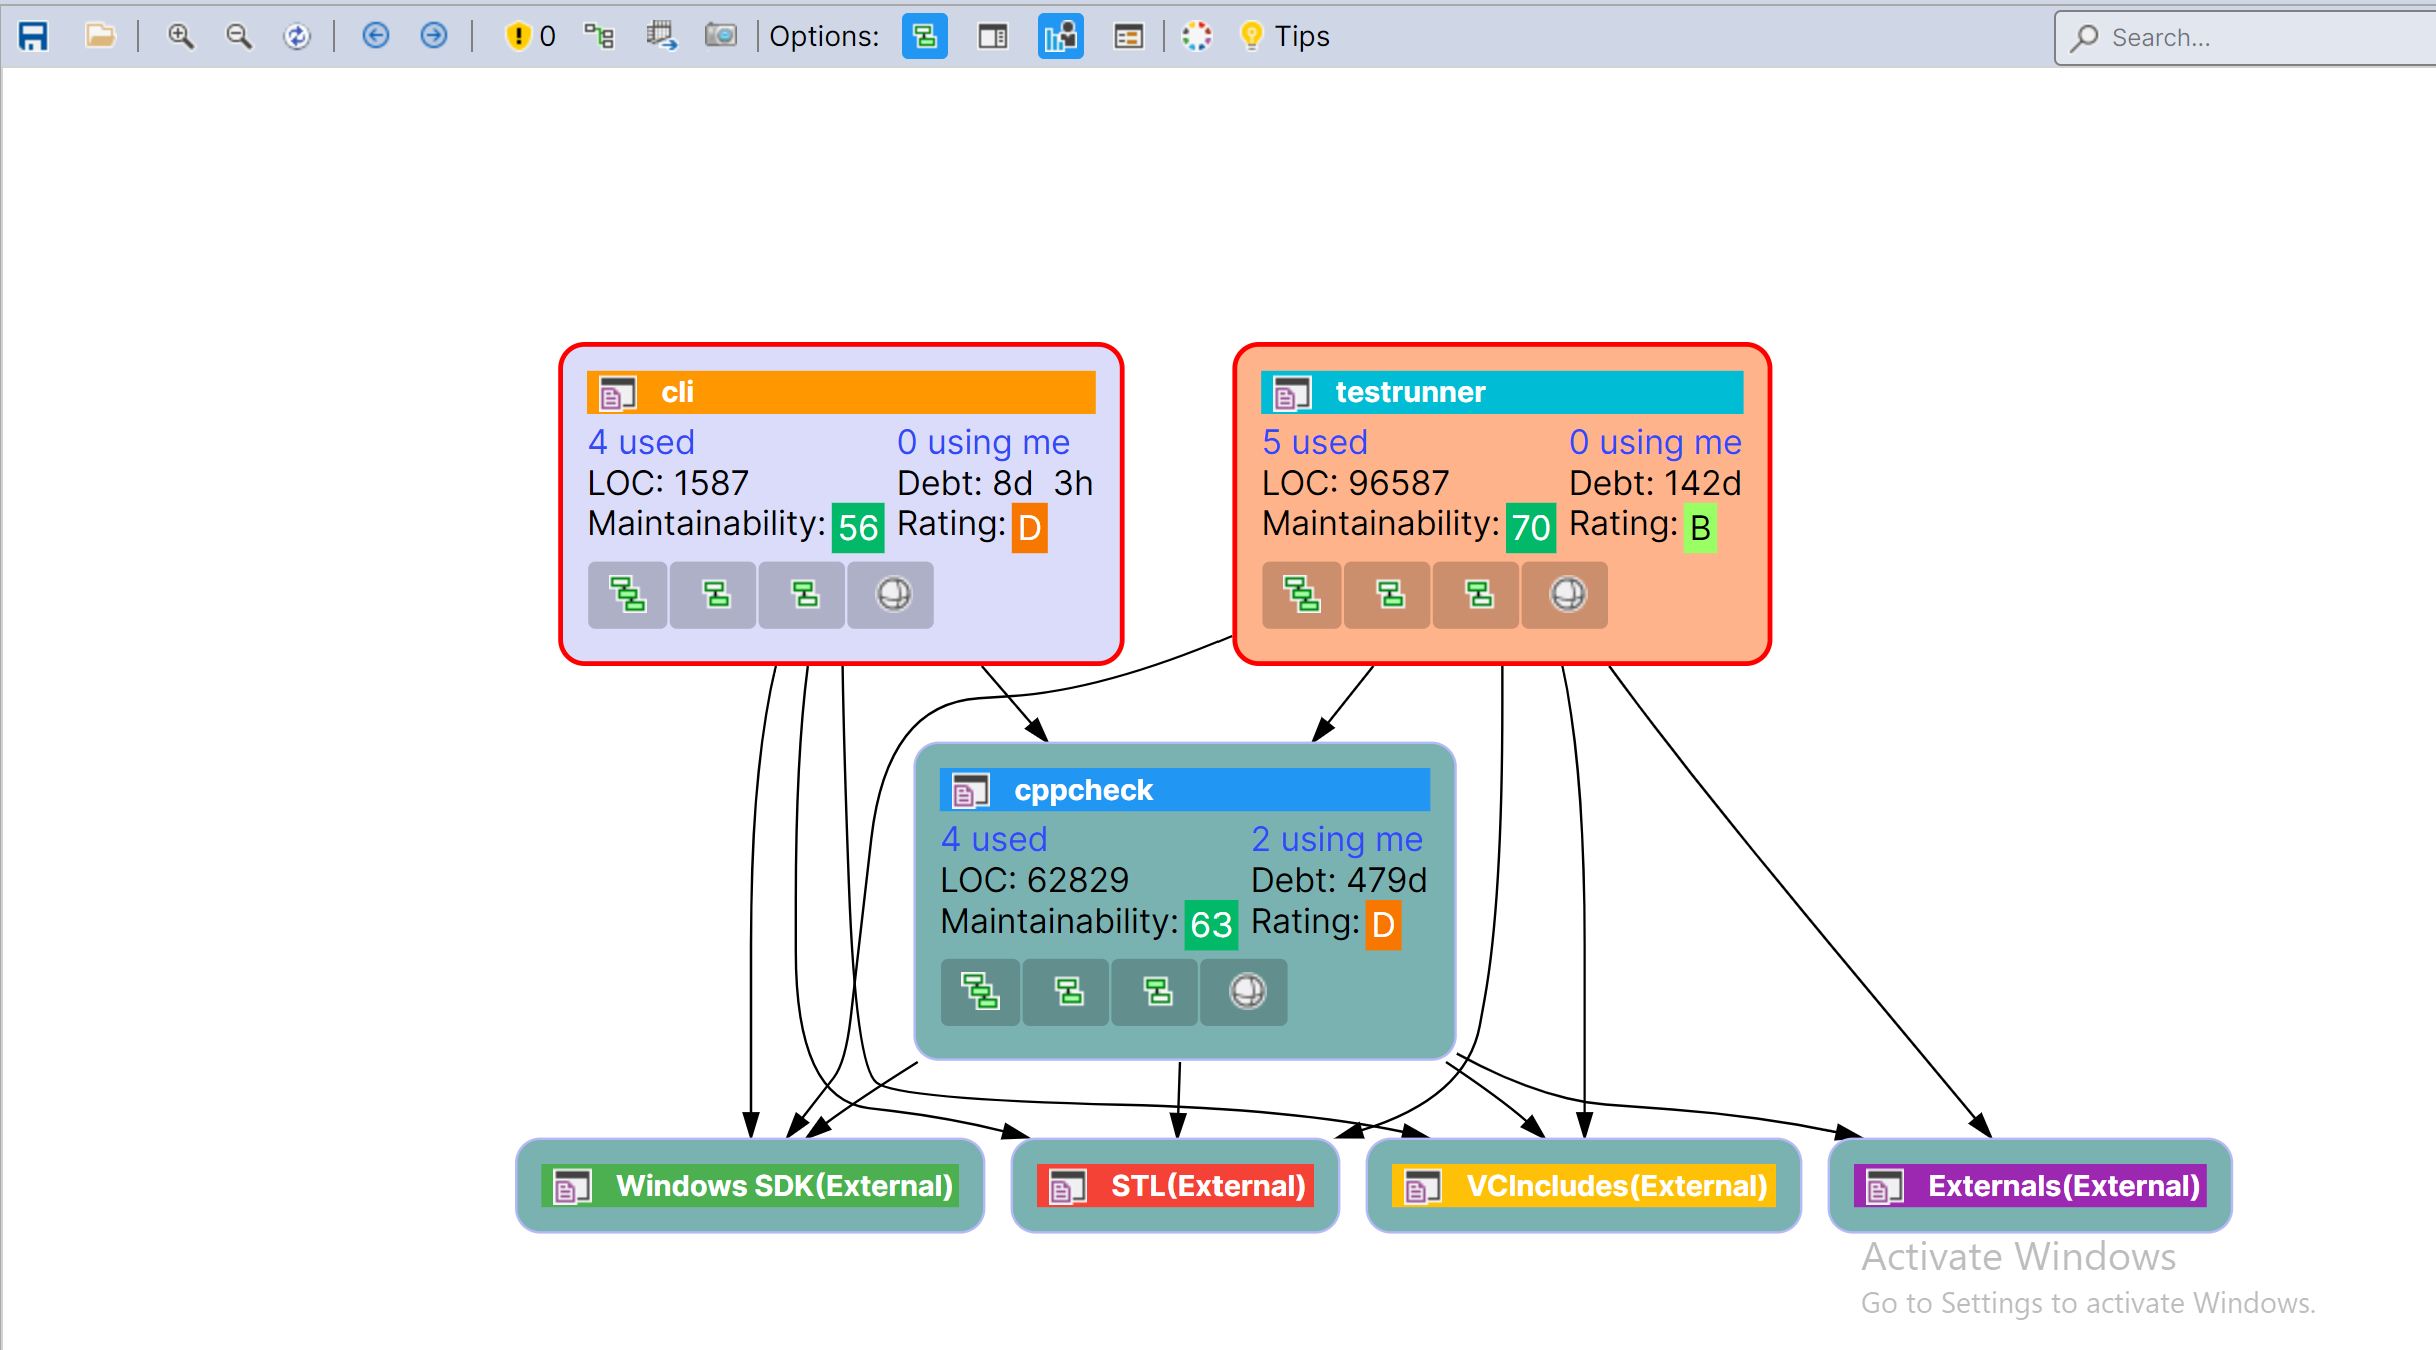
After the selection, the graph keeps the chosen nodes
and also shows their dependencies, which helps you understand how these elements interact with the rest of the design,
as illustrated below.
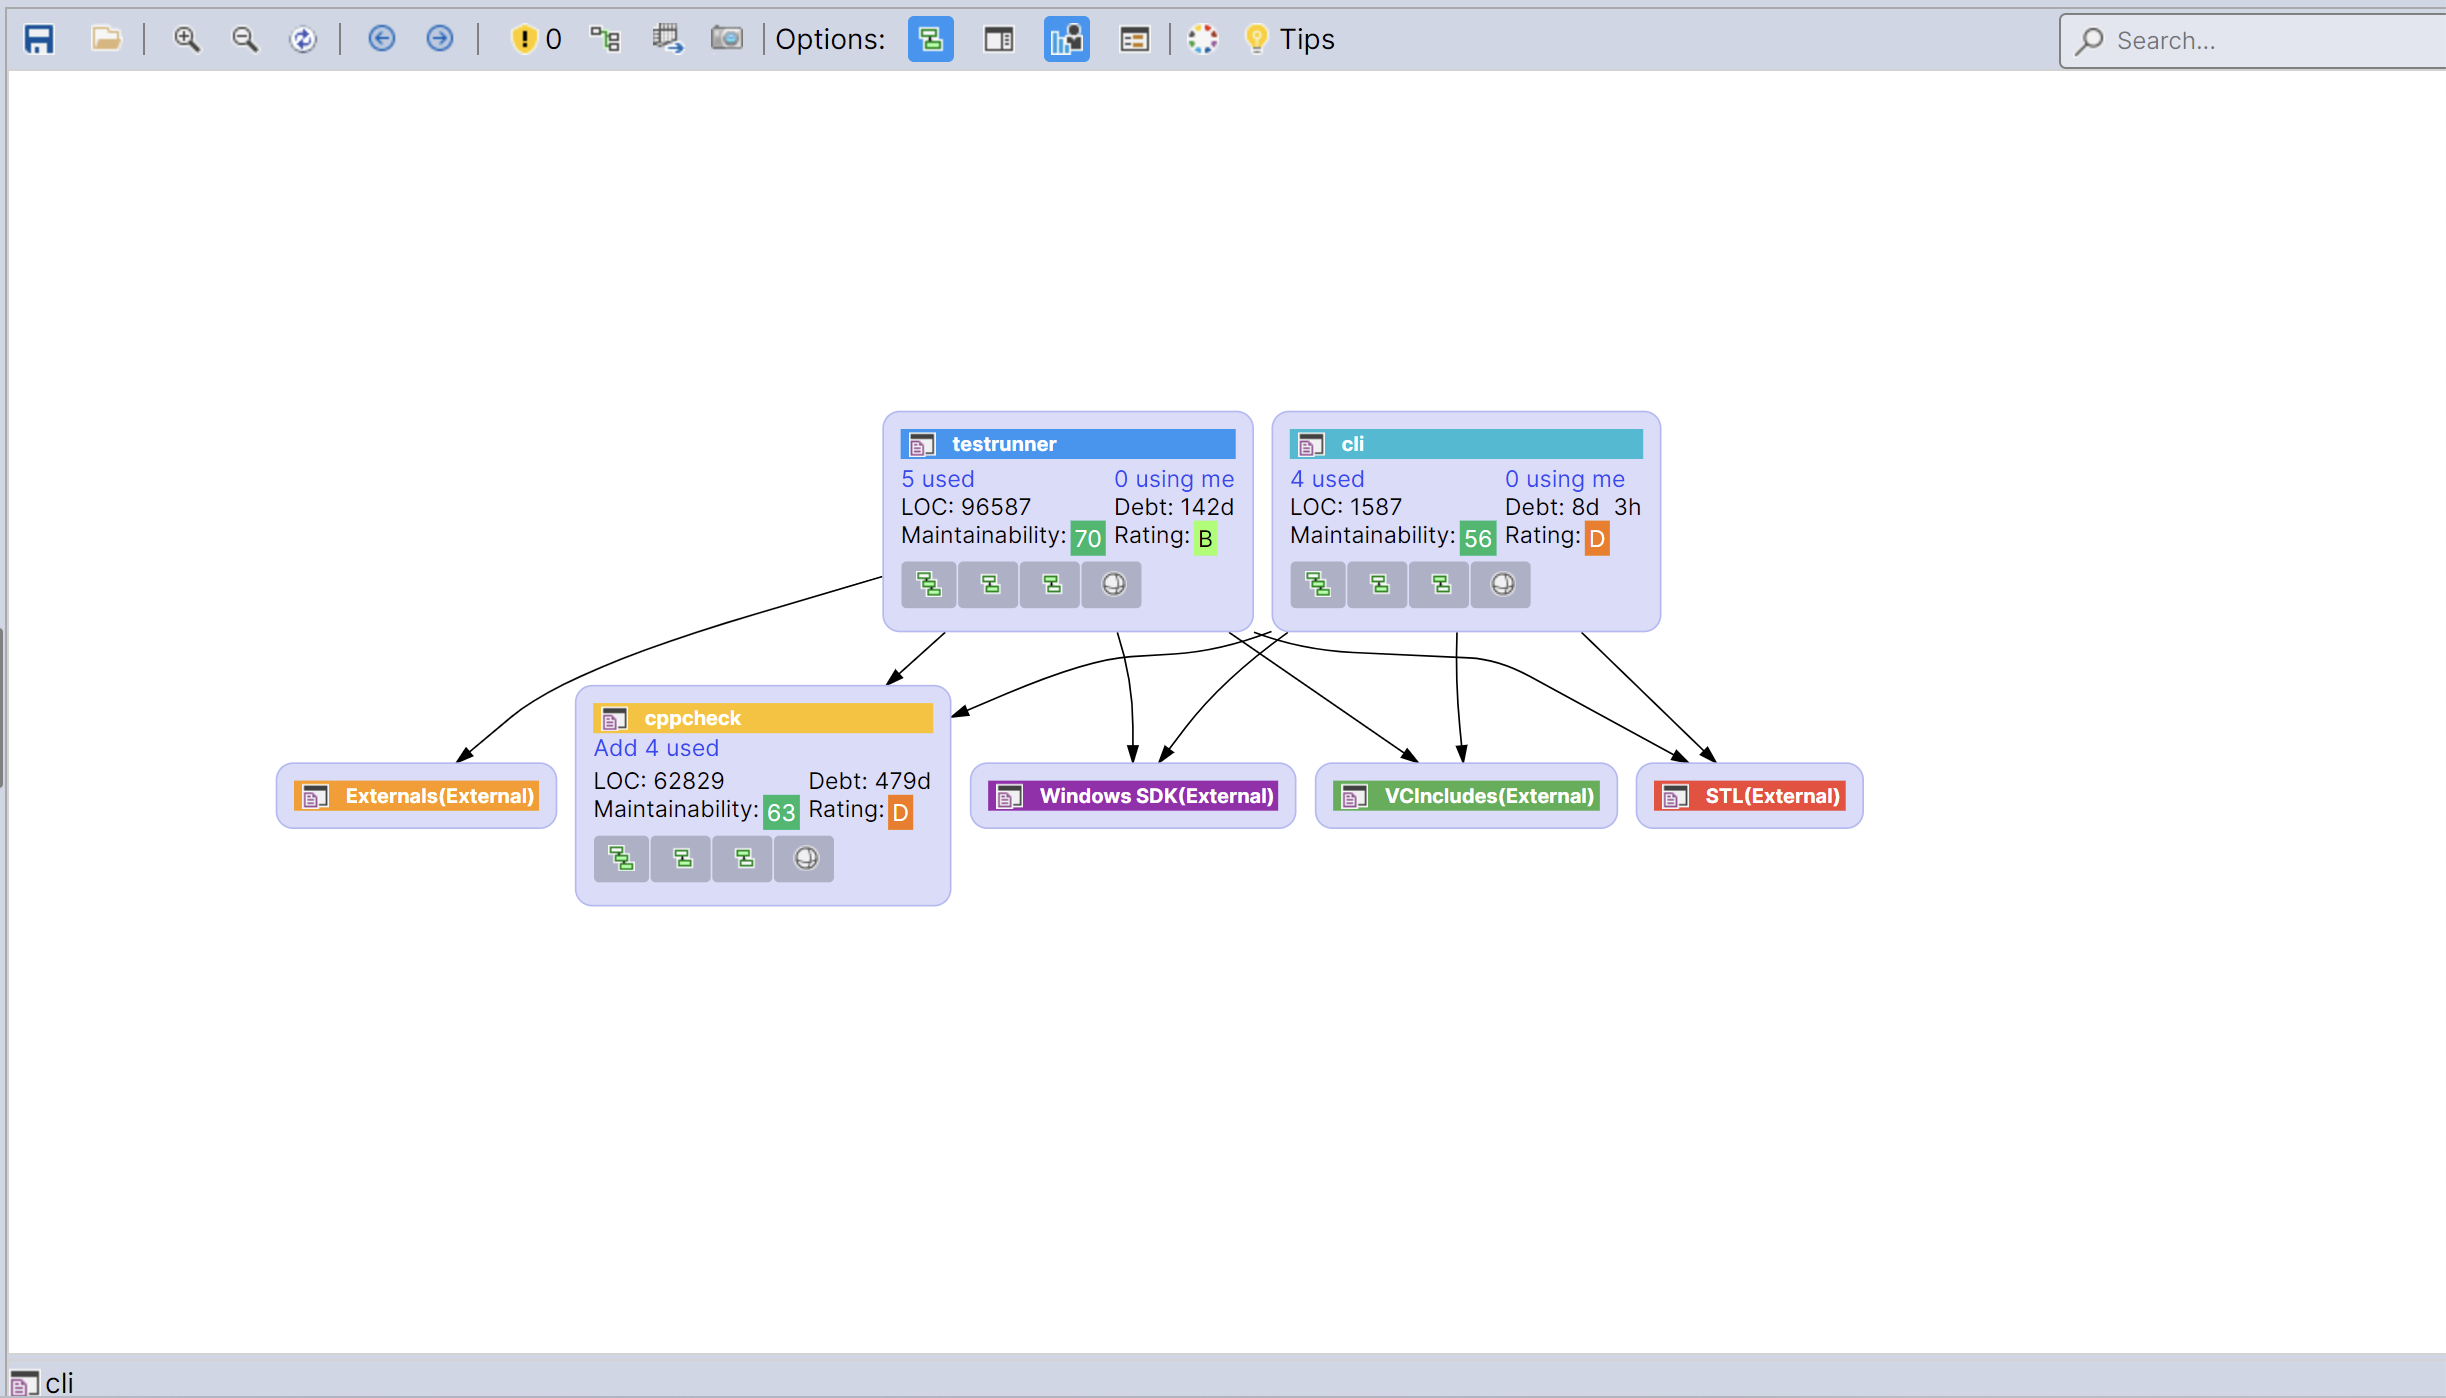
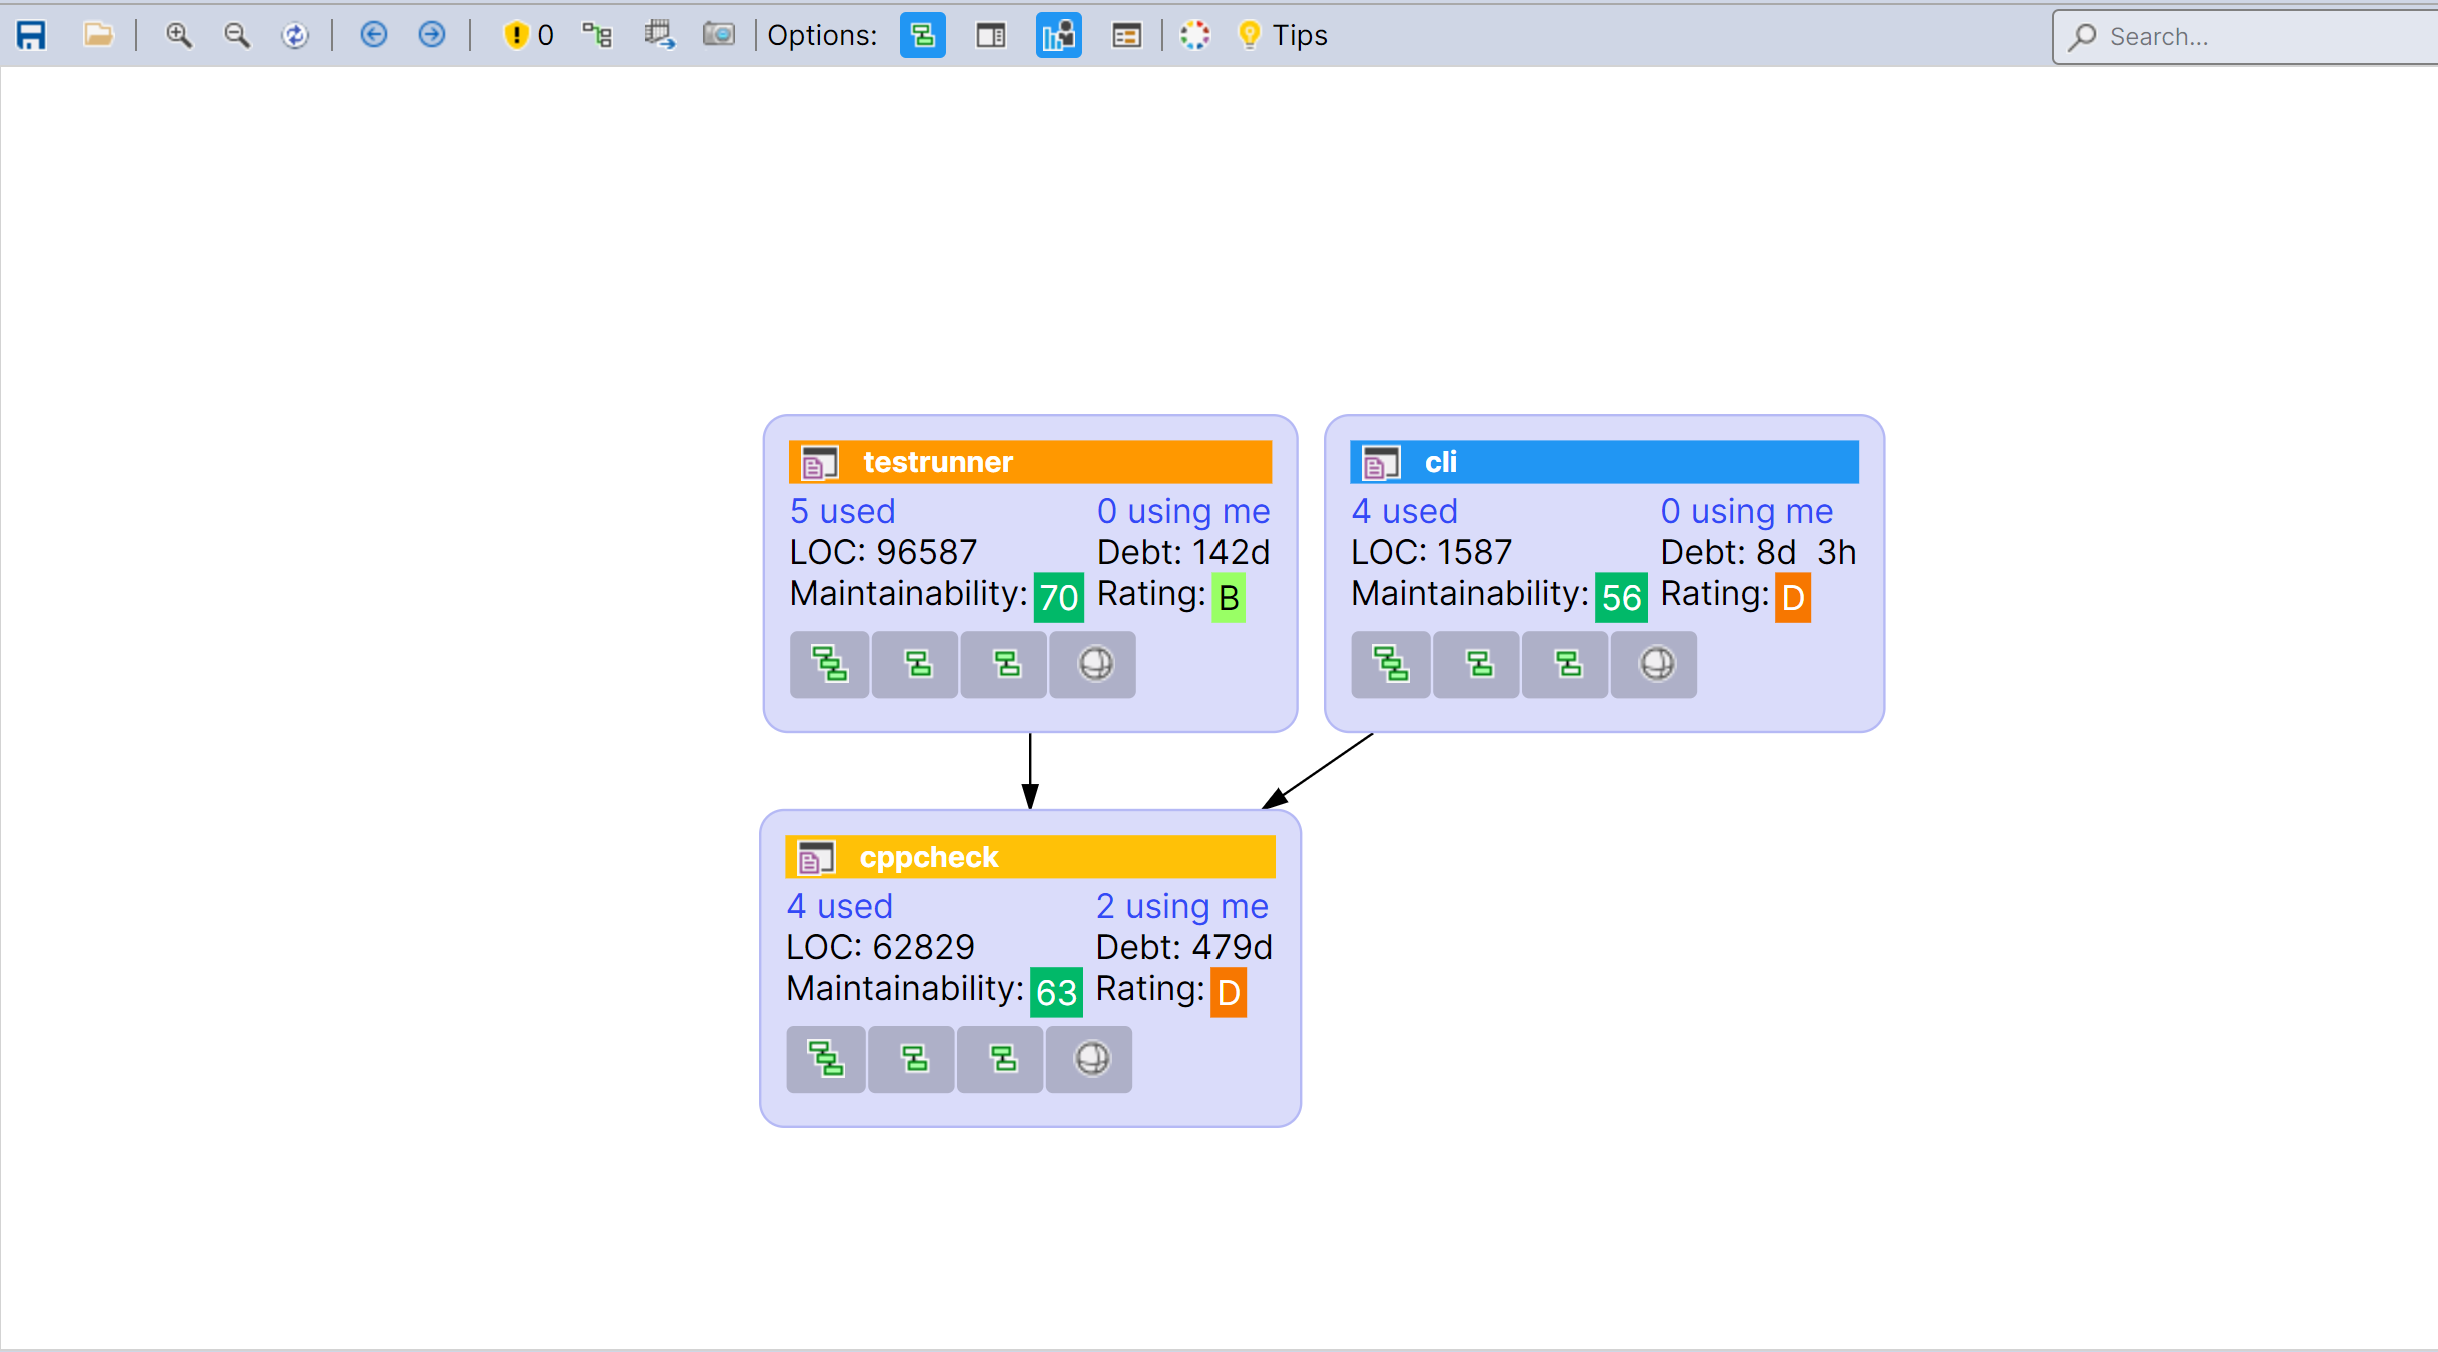
Multi-Selection with Alt
Sometimes you need a cleaner and more focused view that removes the surrounding dependency noise.
The graph below shows 2 nodes selected (highlighted with Red) while holding Alt.
After the selection, the graph displays only the selected nodes
without their dependencies. This is especially useful when you want to isolate a few elements and compare them directly,
as shown below.
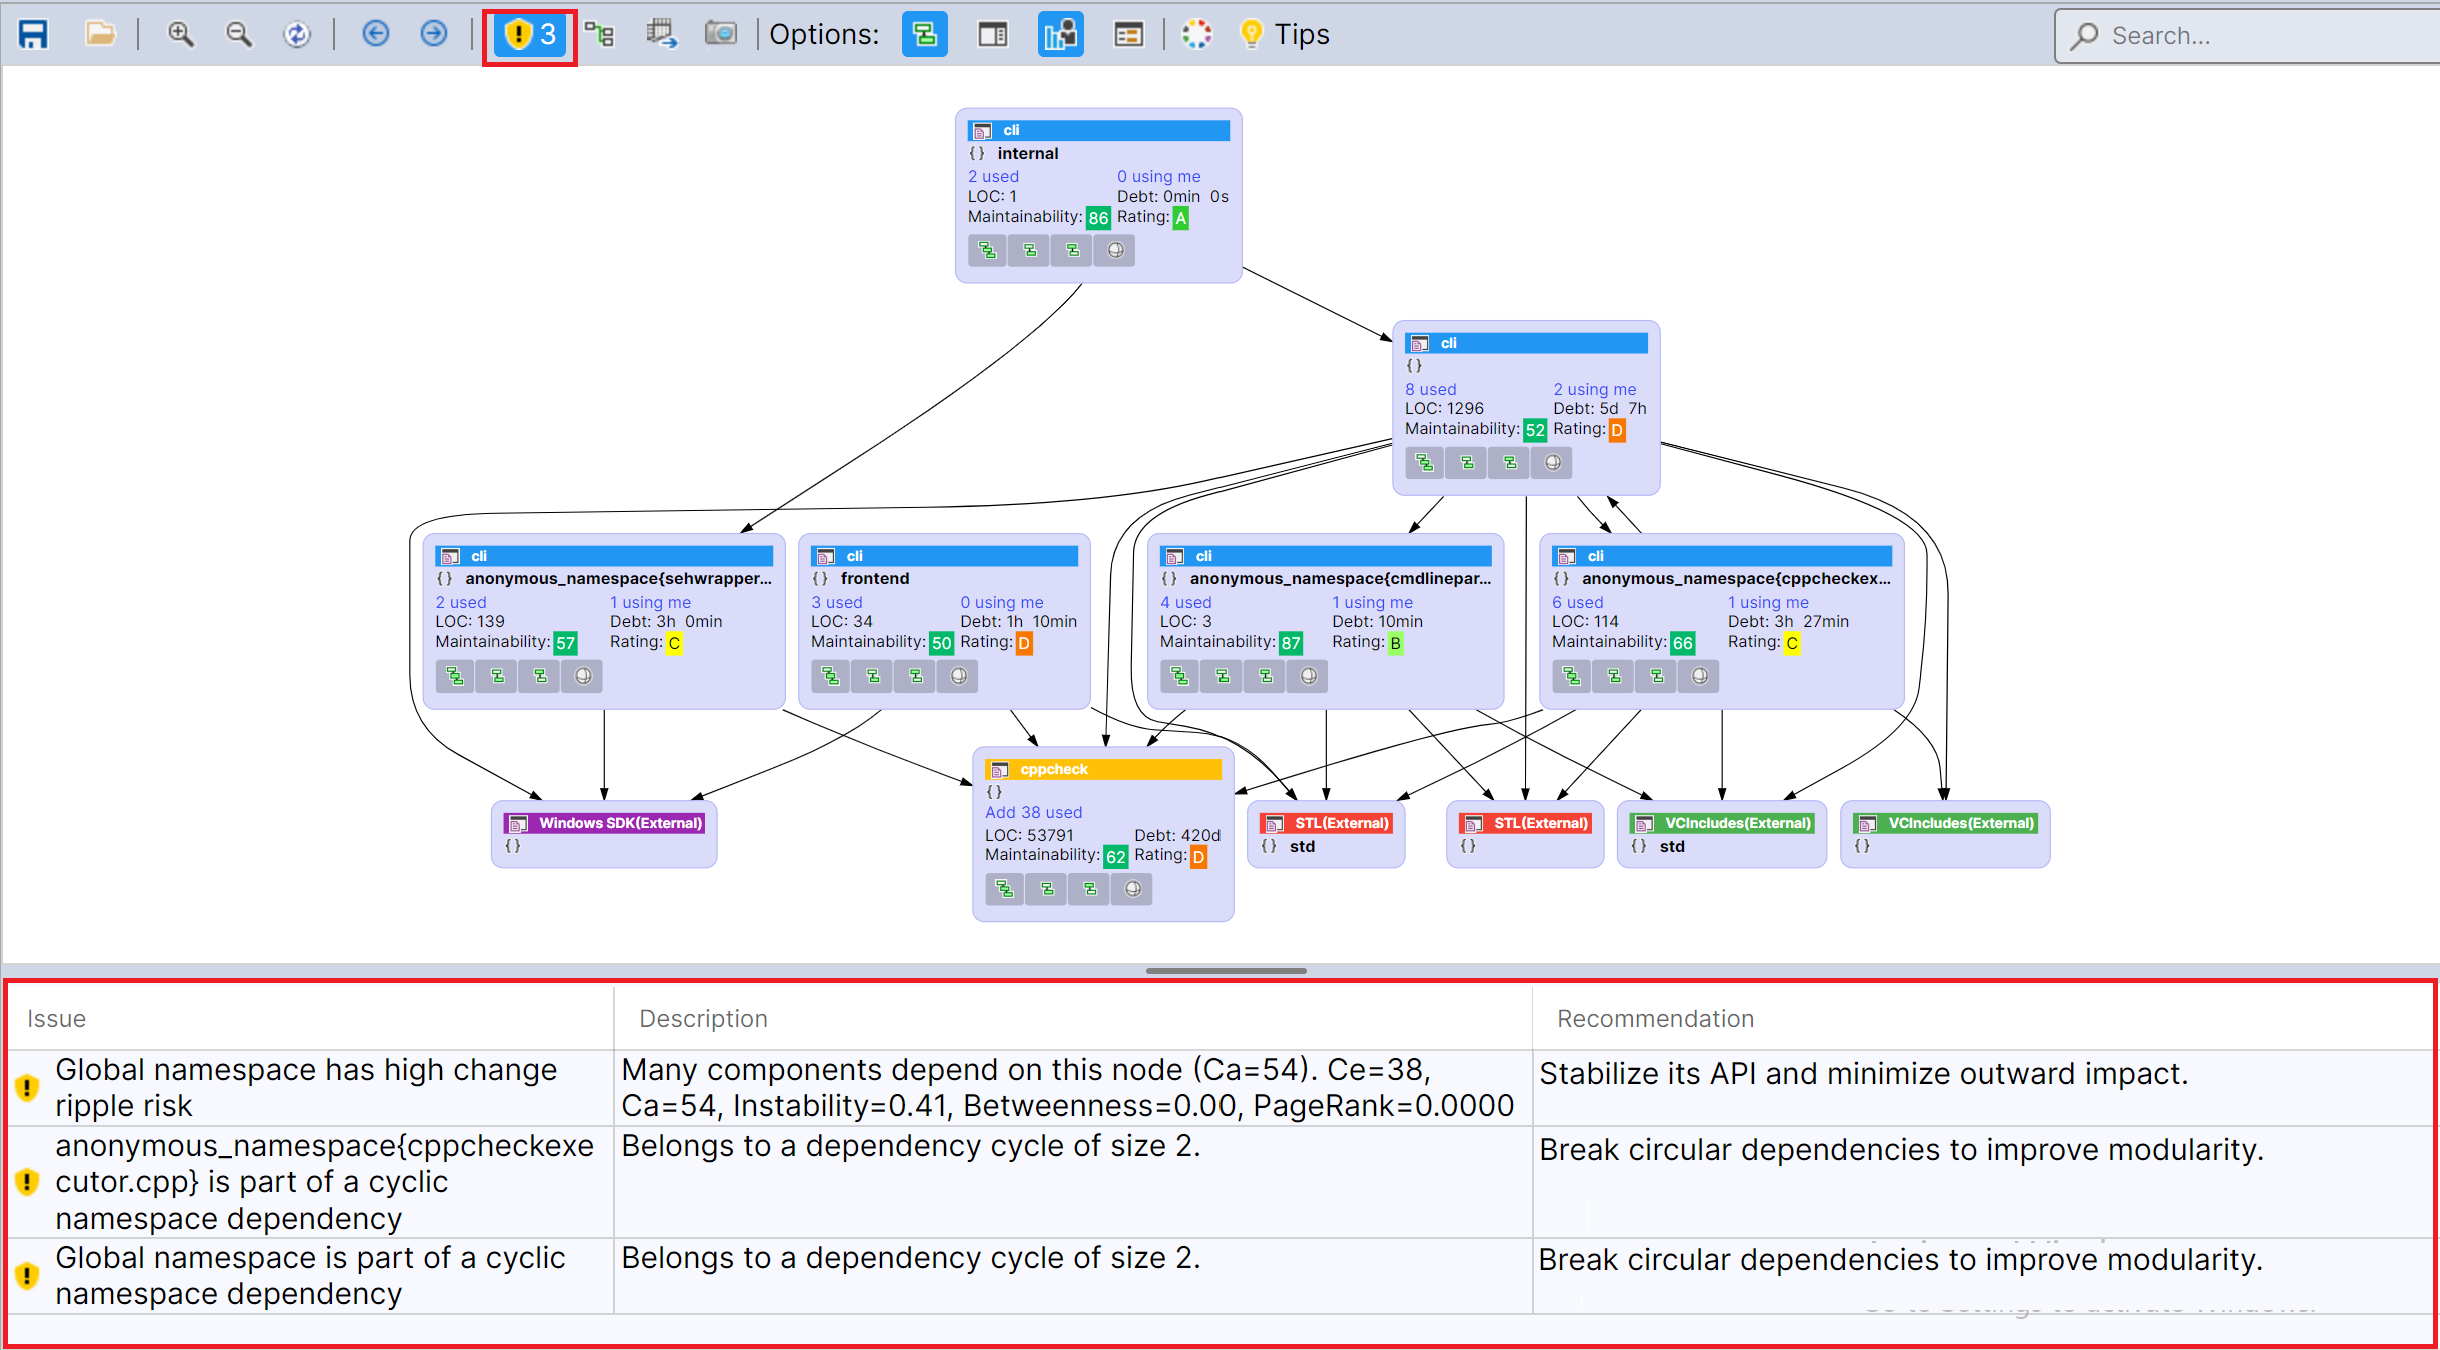
Review Design Issues
The graph is not only a navigation tool. It can also help you detect architectural and design problems directly in the current view.
Use the Issues switch in the toolbar to reveal issues detected in the current graph scope.
This makes it easier to spot problematic areas such as cycles, high coupling, or ripple-risk nodes,
like in the example below.
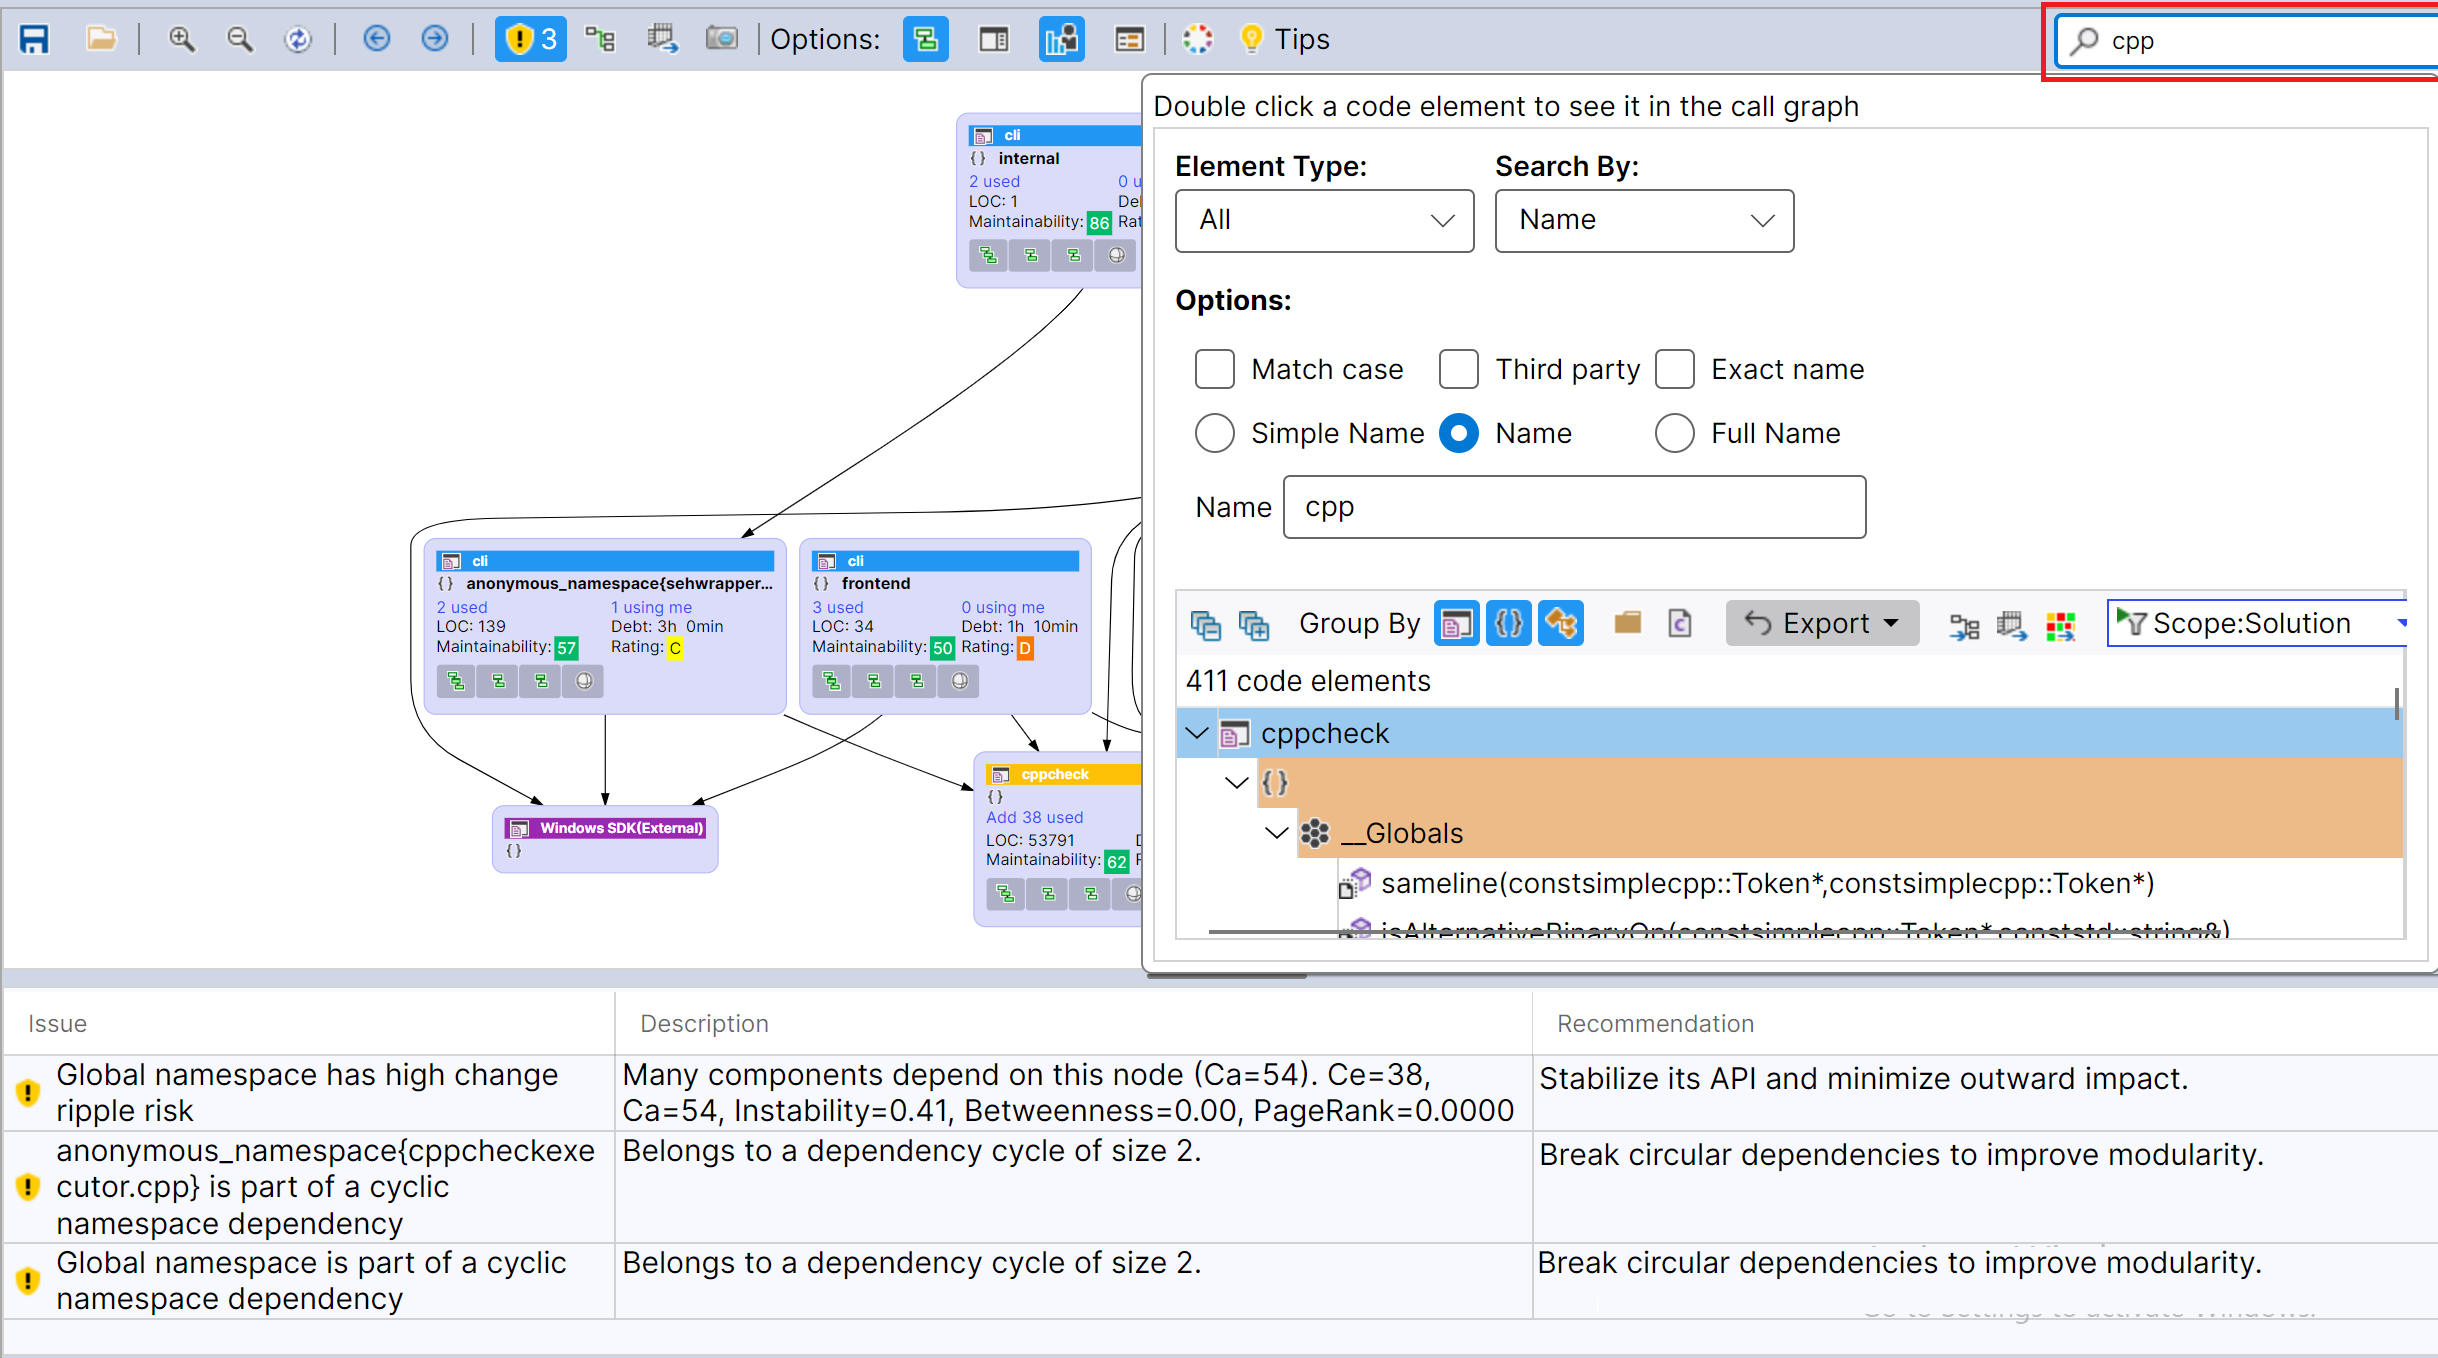
Focus on a Specific Element
When the graph contains many nodes, manually locating a specific code element can become difficult.
The search box is located in the right-side toolbar. Use it to quickly find a namespace, type, or other code element, and focus the graph on the part of the architecture you want to inspect, as shown below.
Hover to Reveal Dependencies
A quick way to understand the role of one element in the graph is to inspect its direct relationships without changing the graph scope.
Move your mouse over a node to instantly highlight its direct dependencies and dependents using color cues.
This makes incoming and outgoing relationships visible at a glance, as shown below.
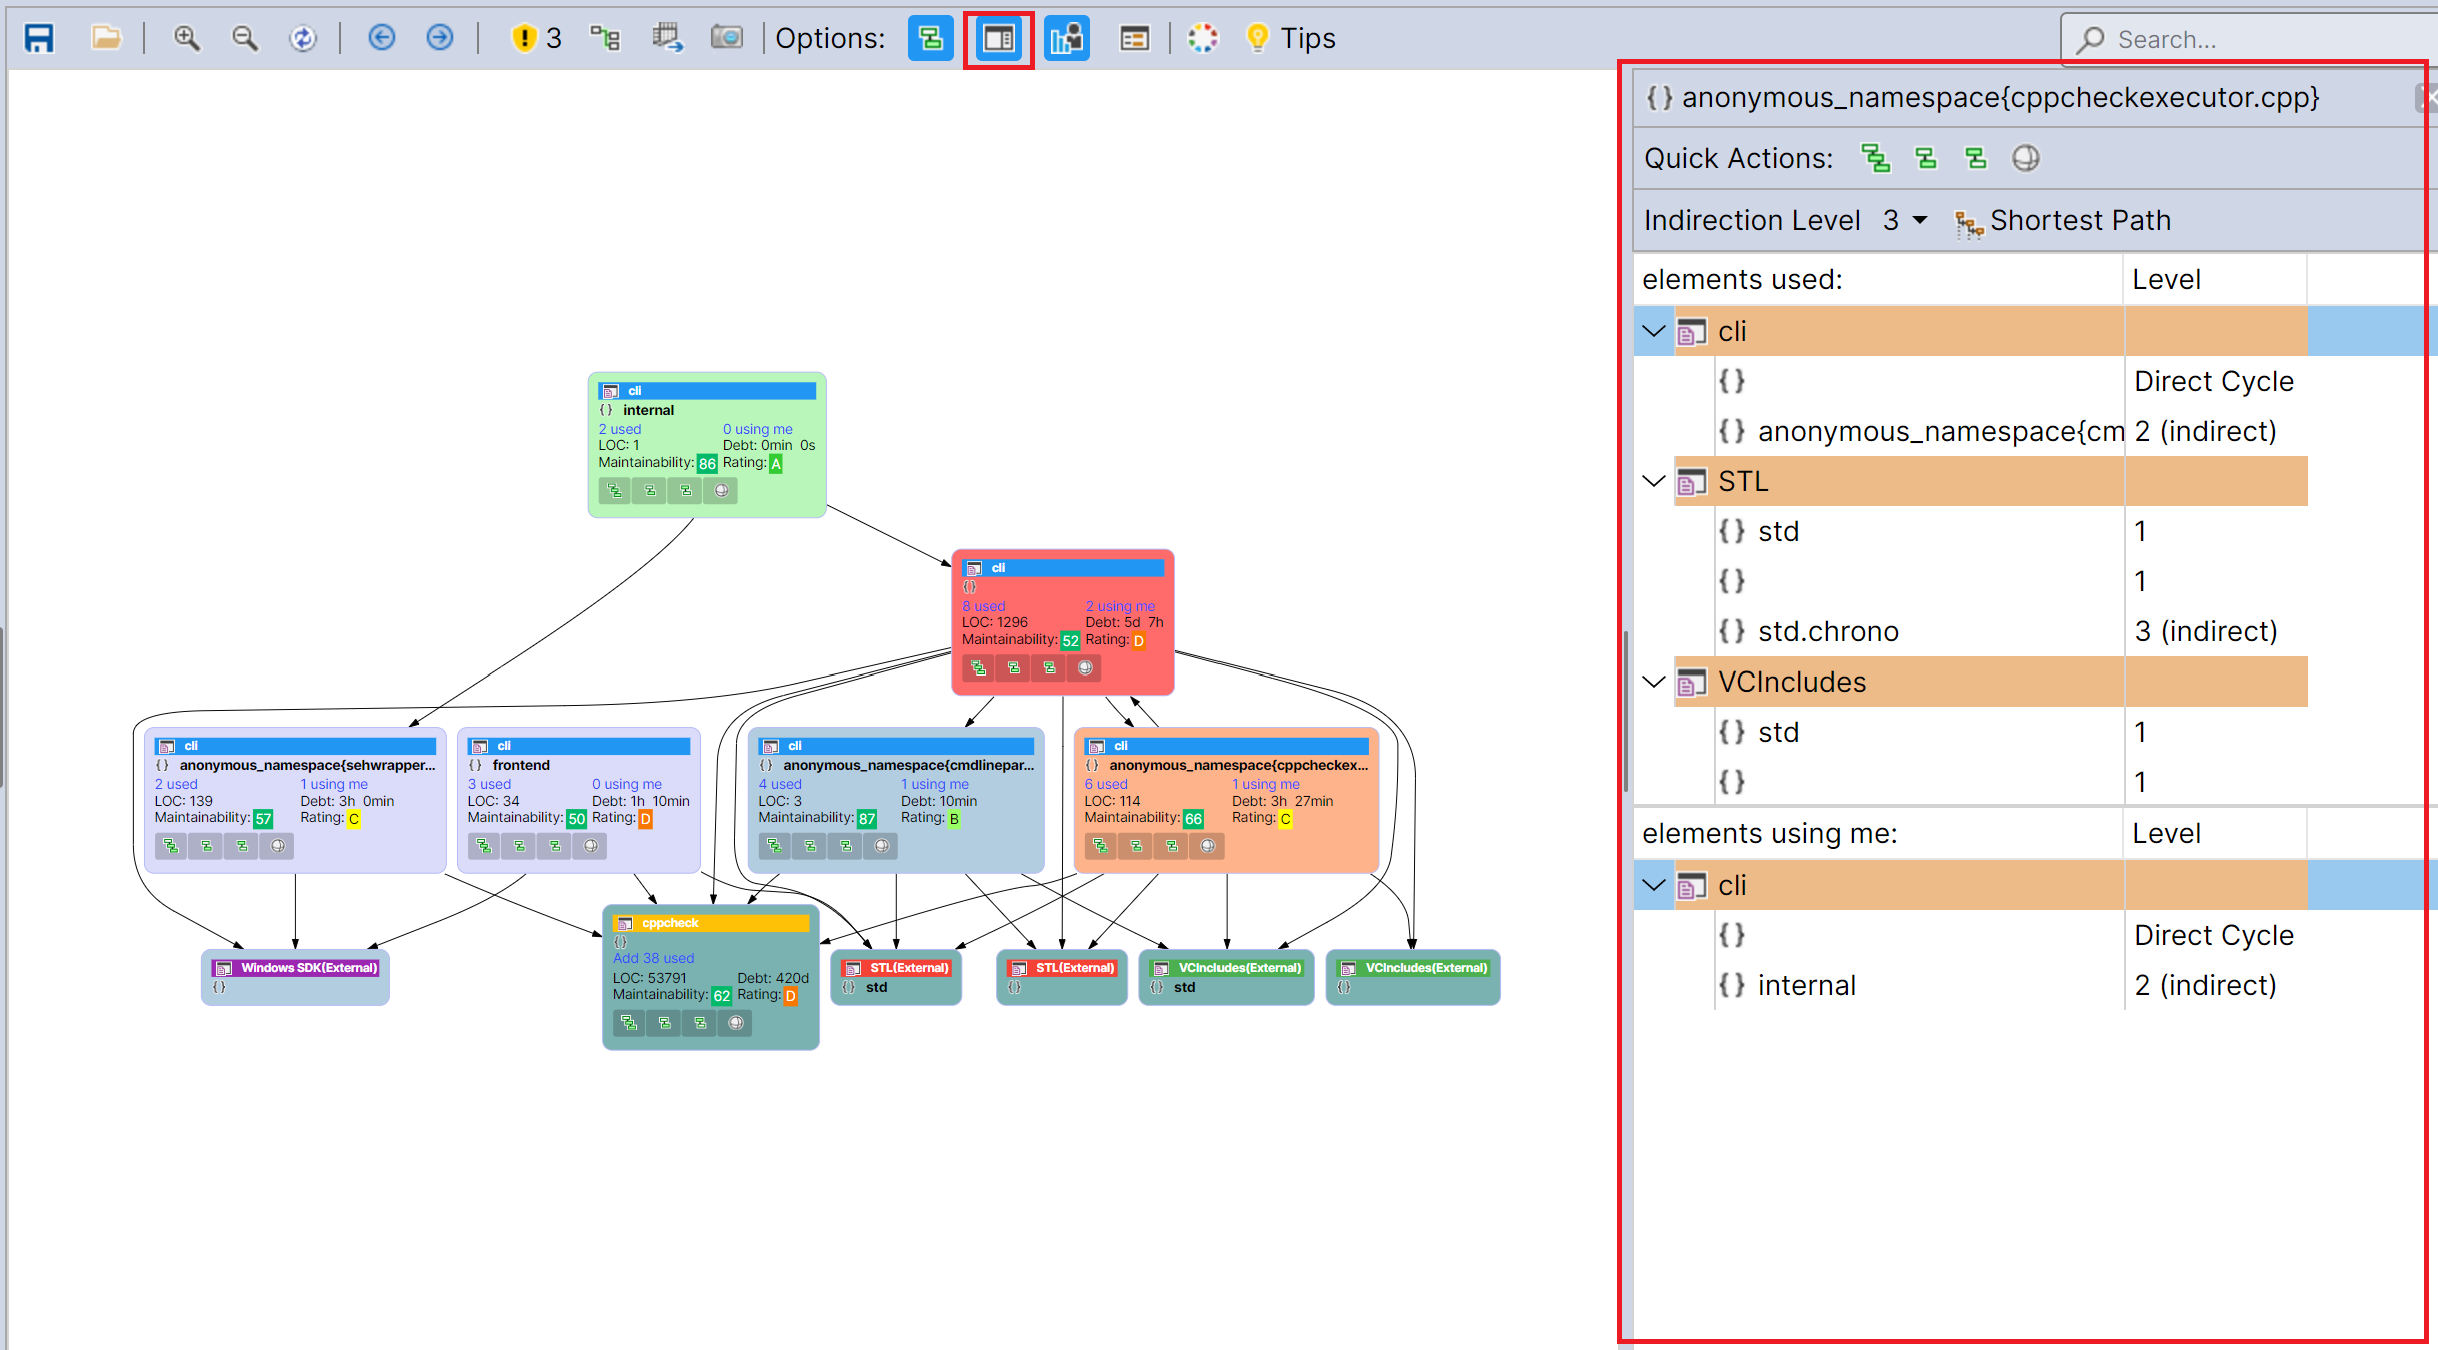
Use the Dependency Grids
Graphs are ideal for visual exploration, but sometimes you need a more structured and exact representation of dependencies.
Use the dependency grids from the toolbar to inspect direct and indirect dependencies in a tabular view.
This is particularly useful when you want to review relationships in detail or analyze them in a more systematic way.
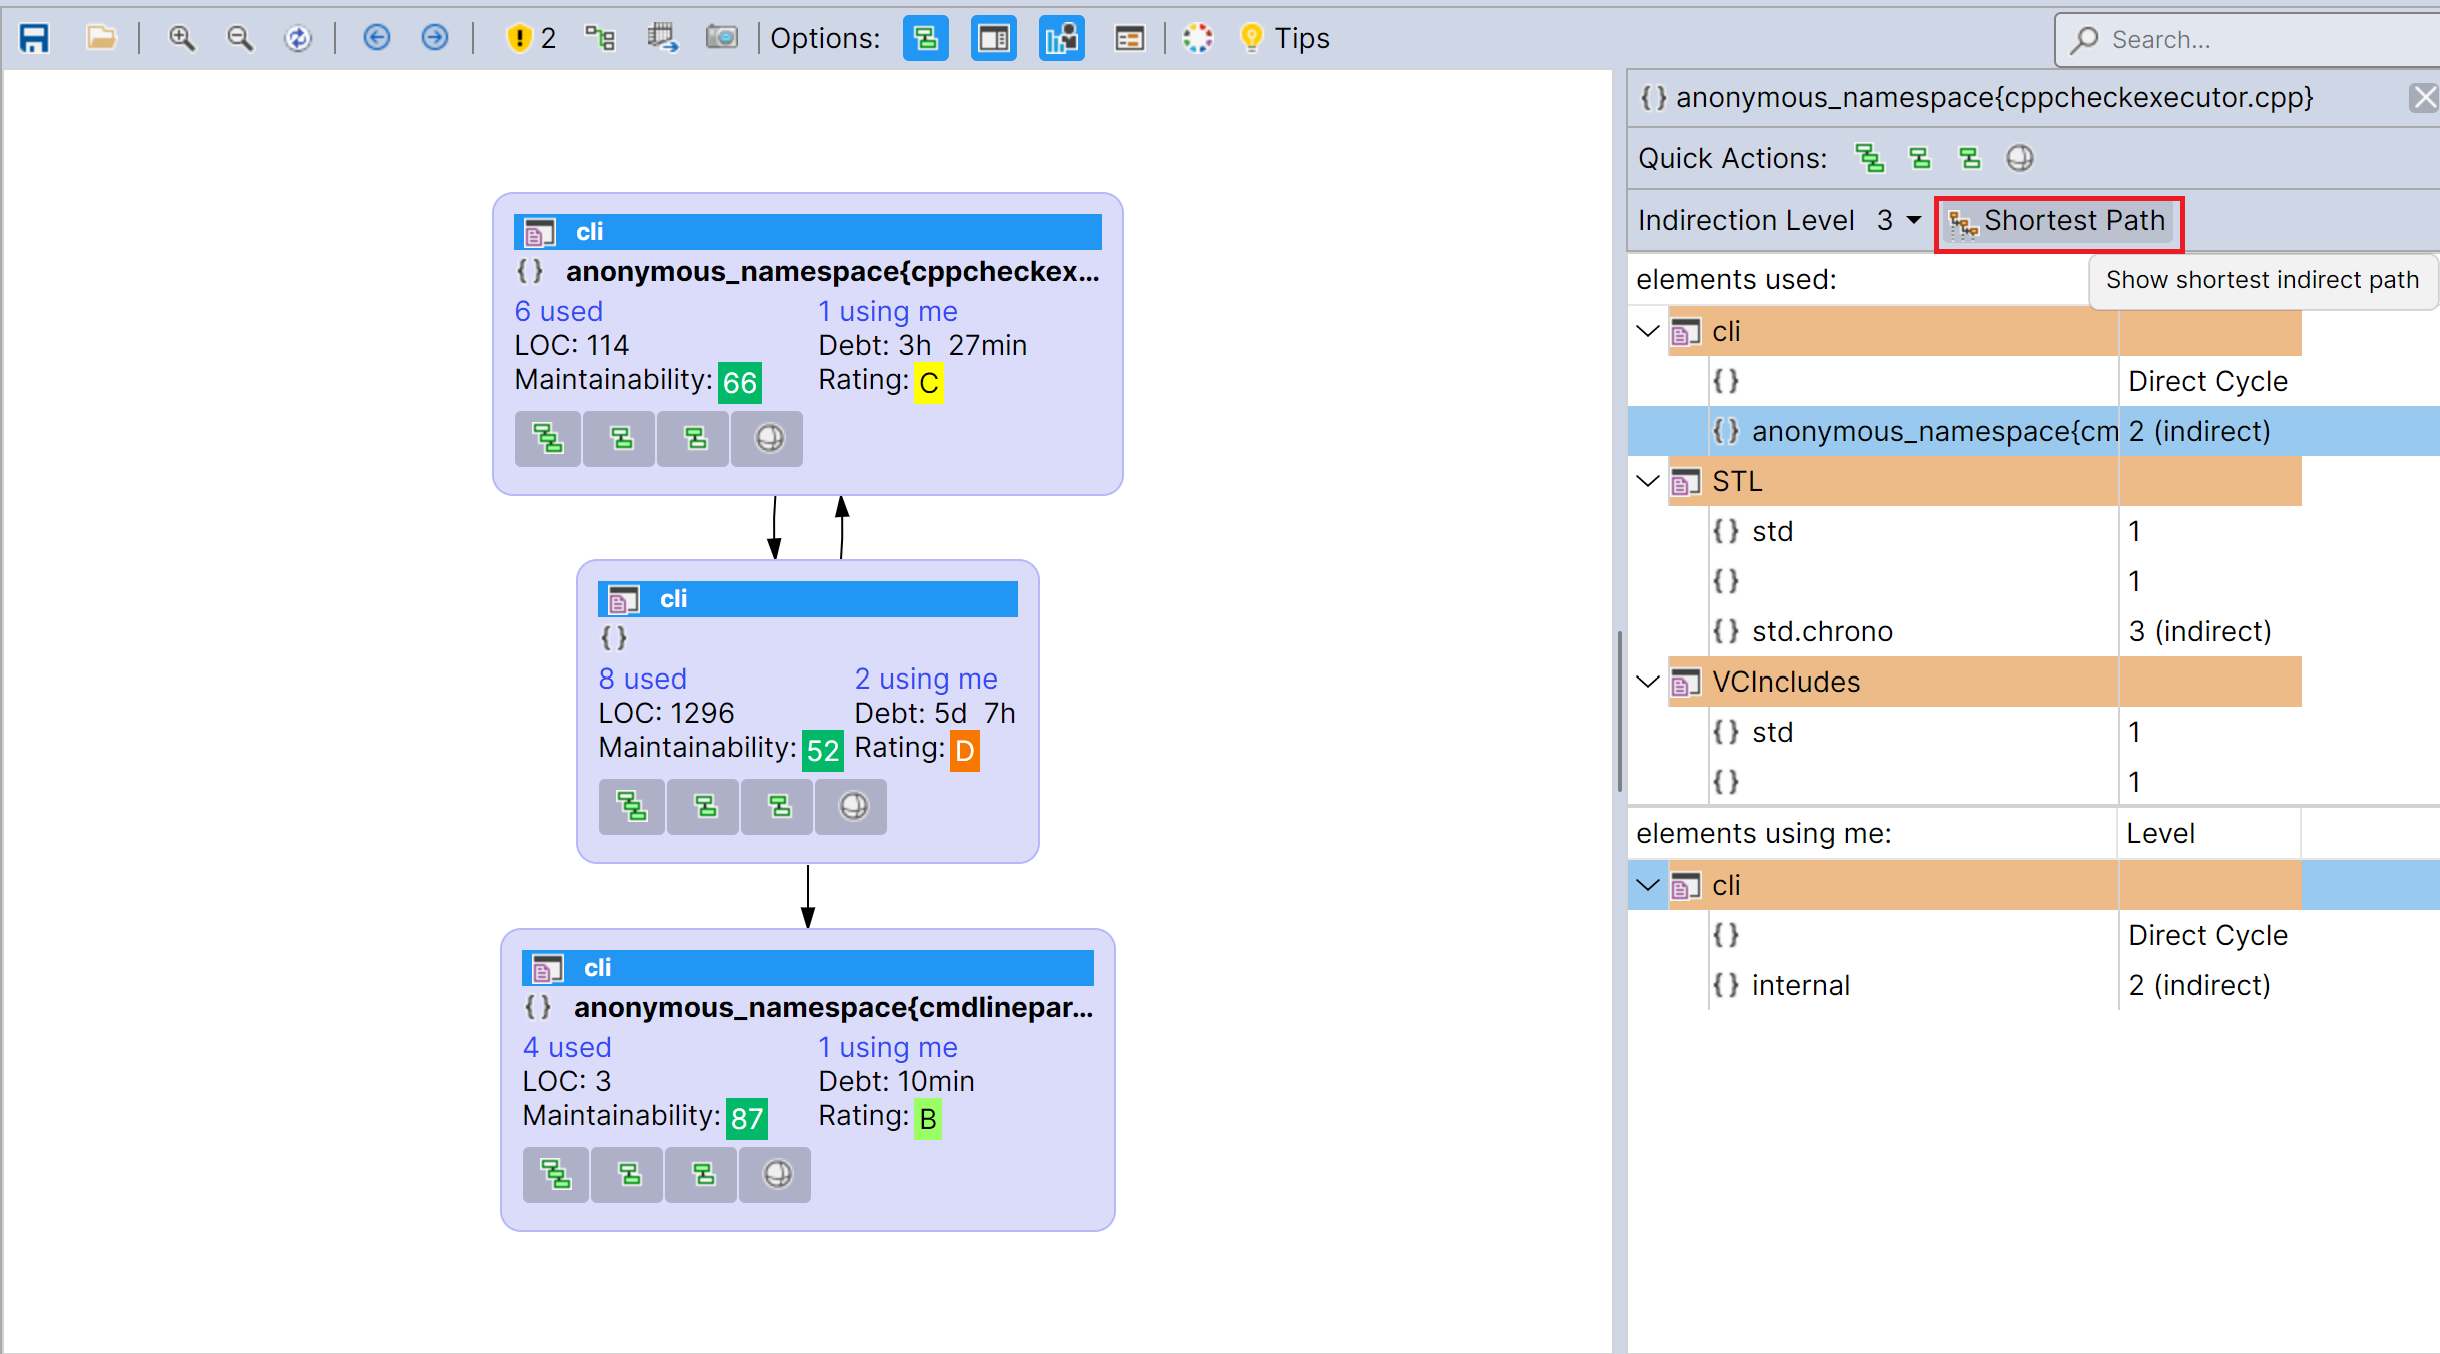
Visualize Dependency Paths
Two components may be linked indirectly through several intermediate elements, which can be difficult to understand from the graph alone.
Use dependency paths to display the exact path between nodes. This helps you understand how components are connected across layers
and why one element eventually depends on another.
Explore Internal Dependencies
In some situations, you may want to inspect what happens inside a graph element instead of only viewing its external relationships.
The graph below shows a node before expanding its internal structure.
Click Show Internals from the toolbar to reveal the internal relationships within the selected graph element.
This provides a deeper view of the structure and dependencies inside that component, as shown below.
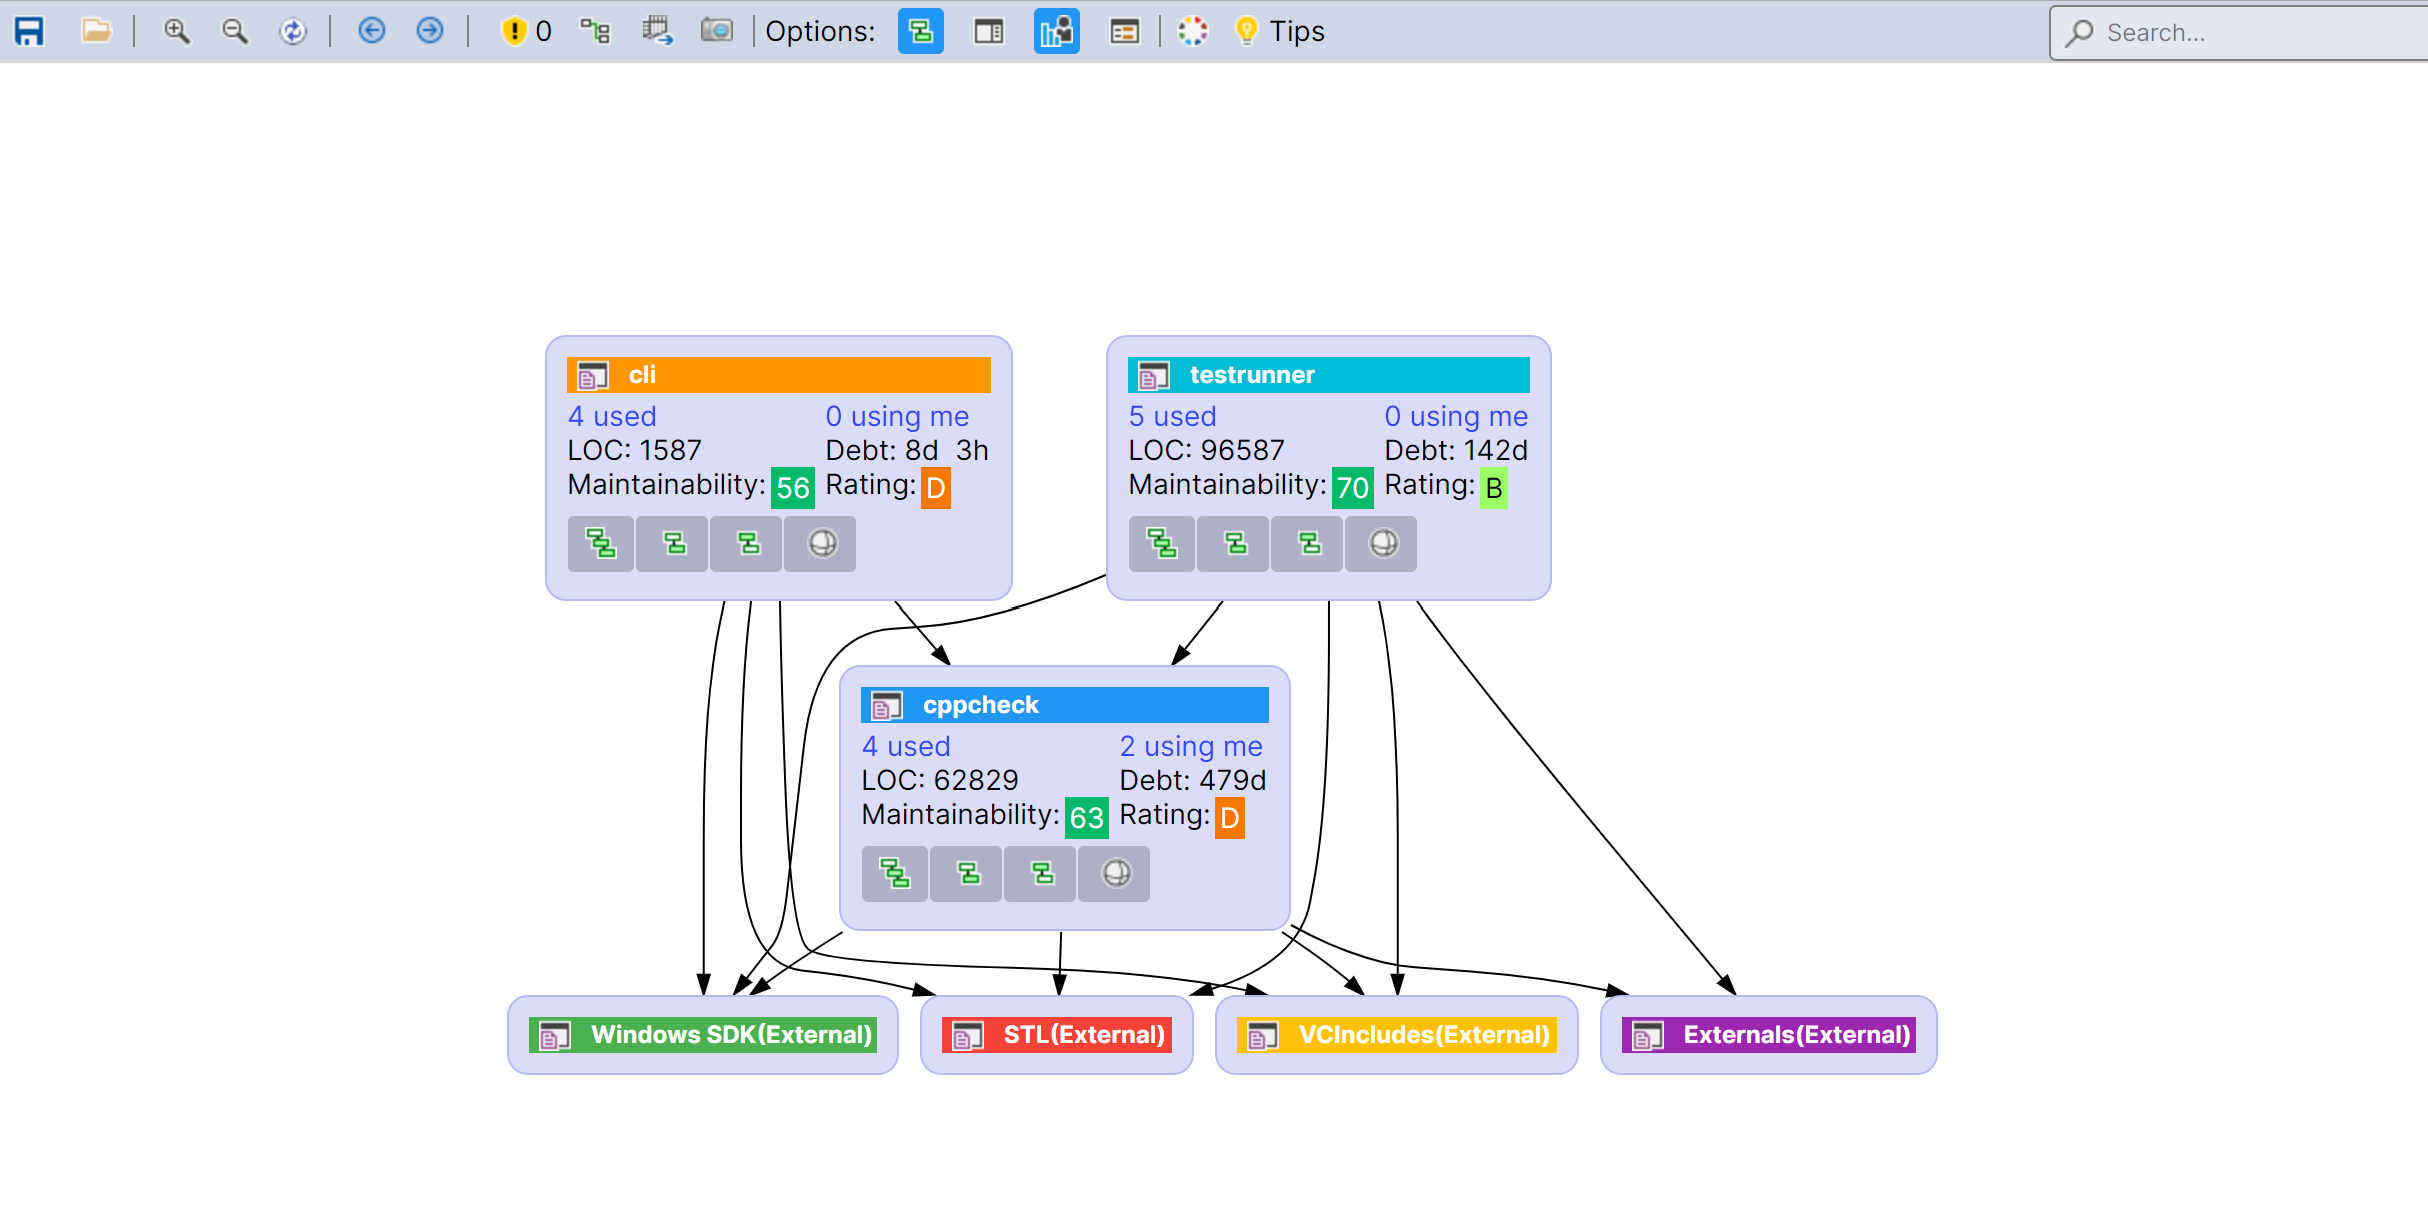
Use Compact Mode for Large Graphs
When a graph becomes large, readability can quickly decrease because of visual clutter and the number of displayed details.
Enable Compact Mode from the toolbar to reduce clutter and keep the main relationships easier to read.
This is especially helpful when navigating broad architectural views, as illustrated below.
Recommended Workflow
A practical way to explore the Dependency Graph is to start from a high-level view, use the search box to locate a specific element,
hover nodes to understand direct relationships, and then drill down when you need more detail.
From there, you can refine the graph with Ctrl or Alt multi-selection,
enable Issues to reveal design problems, and switch to Show Internals or
Compact Mode depending on the depth of analysis you need.