
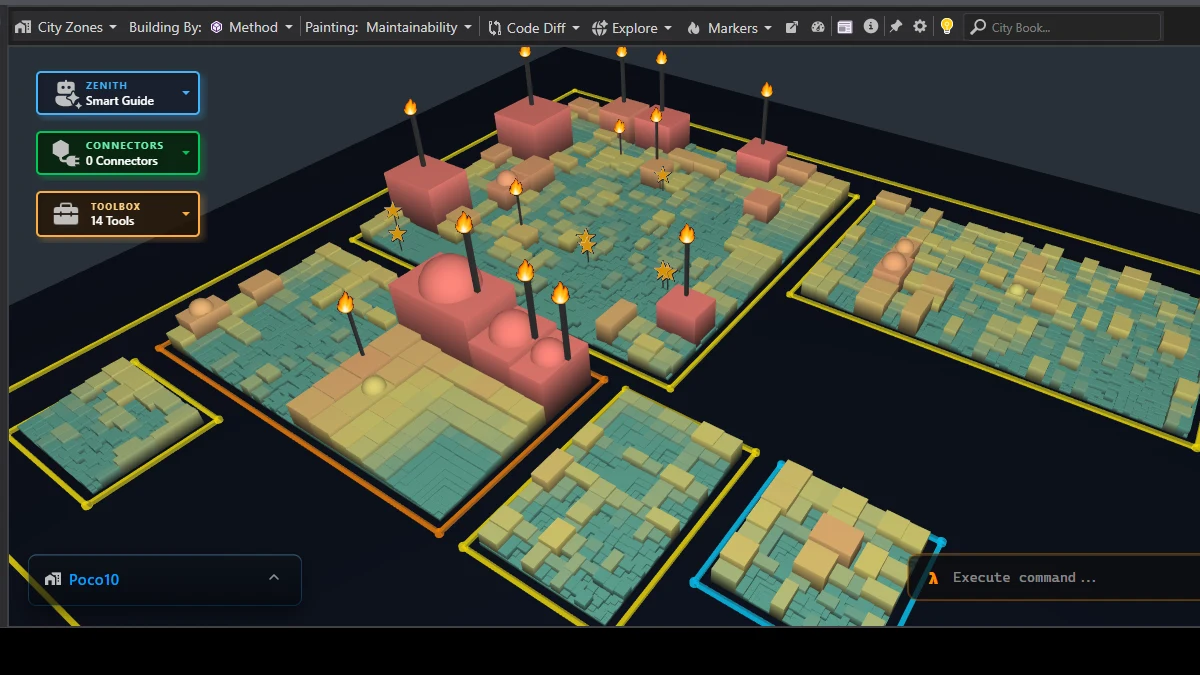
AI can generate code incredibly fast. But there’s a catch: more code doesn’t necessarily mean more understanding.
When a large AI-generated codebase starts growing — classes, dependencies, modules, relationships, inheritance — reading file after file can quickly become overwhelming. That’s where visualization becomes powerful.
A Living 3D City for Your Codebase
With CppDepend Smart Code City, a large C++ codebase can be transformed into a 3D city where every visual element carries meaning:
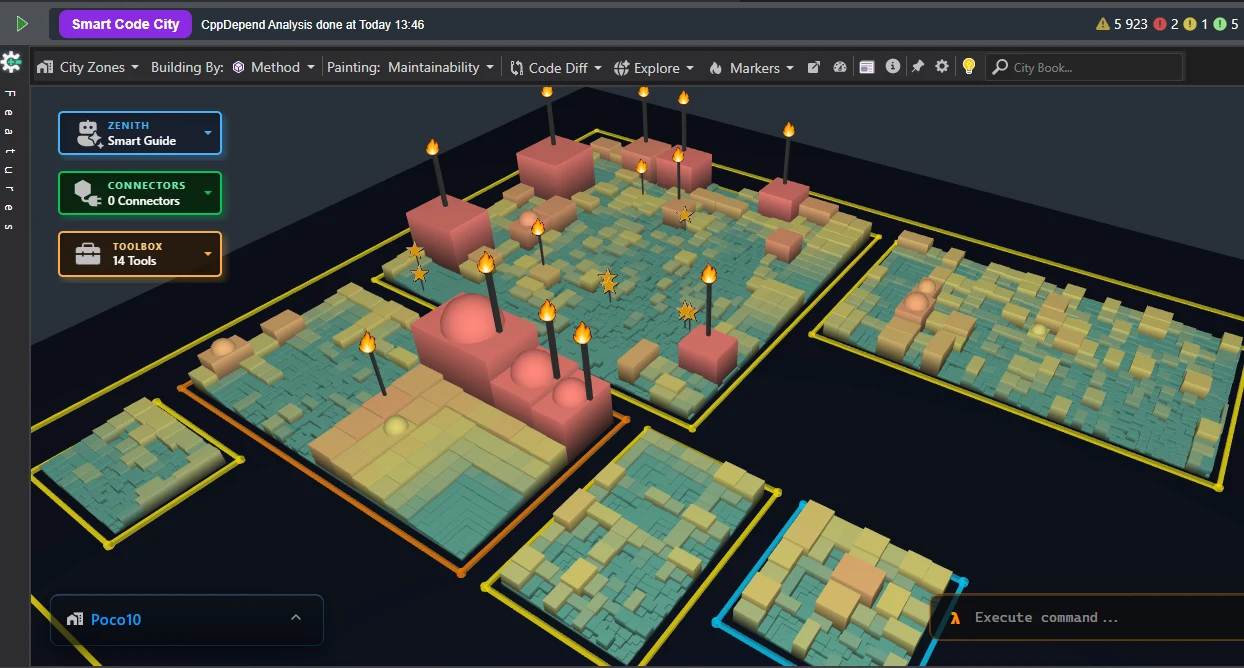
- Buildings: represent individual C++ code elements (methods or classes).
- Building dimensions: height and footprint reflect key code metrics (Lines of Code, cyclomatic complexity).
- Color heatmap: color intensity corresponds directly to maintainability, debt, or rule violation severity.
- Domes: highlight high coupling and complex structural dependencies.
- District borders: bounded yellow/orange outlines map module, namespace, or directory ratings.
- Flame markers: pinpoint top-priority items and critical technical debt requiring immediate refactoring.
- Star markers: identify heavily used or highly central code elements across the system.
Instead of asking “Where should I start reading this code?”, you can ask: “What does this codebase actually look like?”
And that becomes particularly interesting with AI-generated code. AI makes it easier than ever to create large amounts of code. But as code volume increases, architecture, maintainability, coupling, and complexity become harder to reason about. A visual map gives developers another layer of understanding — one that complements traditional code review and static analysis.
Generate with AI. Analyze with metrics. Understand with visualization. Turn massive generated codebases from a wall of text into something you can explore, navigate, and reason about.
Query Your Codebase, See It in 3D (CQLinq Integration)
Smart Code City links CppDepend's CQLinq (Code Query LINQ) engine directly to the 3D visual landscape:
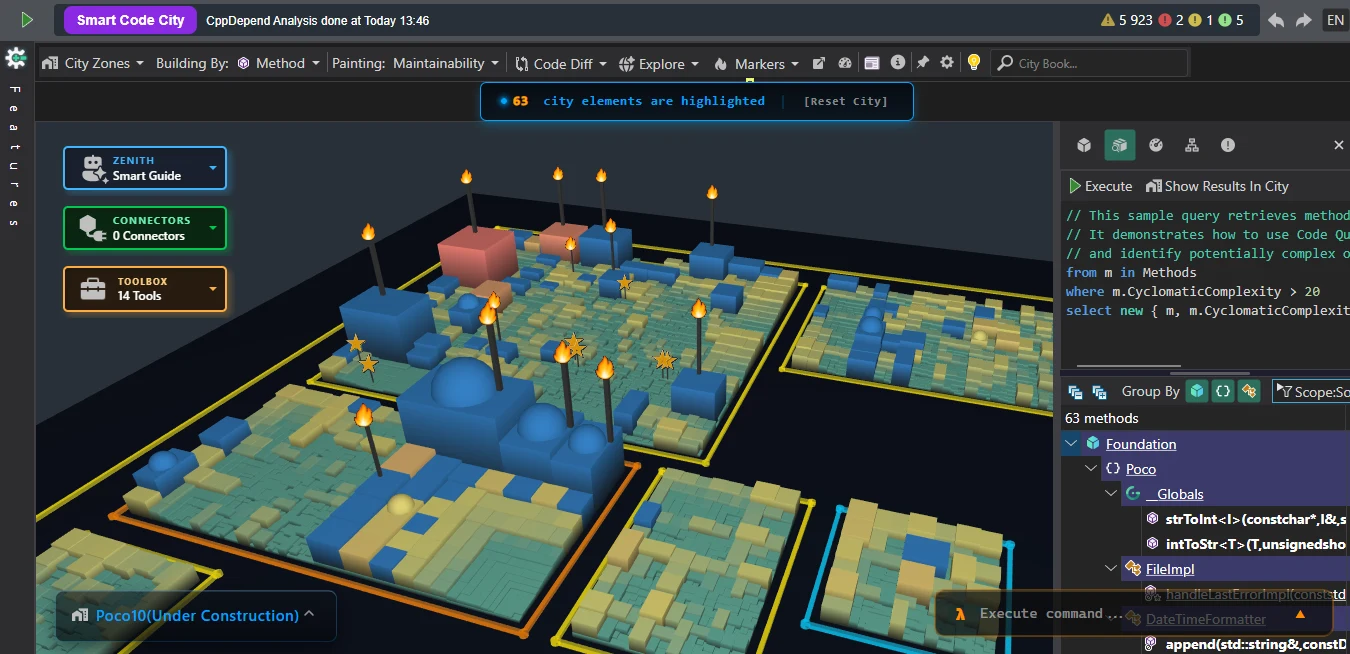
- Live 3D city highlighting: executing a CQLinq query instantly lights up matching code elements in bright blue across the city landscape (e.g., 63 city elements highlighted).
- Real-time spatial filtering: query for high complexity, missing tests, circular dependencies, or recent AI modifications, and watch the matching buildings illuminate across their respective districts in real time.
- Integrated query editor & result tree: write queries in the right panel and explore structured results grouped by namespace, class, or method — with synchronized 3D selection.
With CQLinq integrated directly into Smart Code City, you can write C#-like queries to inspect your C++ codebase and see the results instantly highlighted across the 3D cityscape.
See What Changed — Not Just What Exists
One of the most useful parts of this visualization is being able to see the code evolution directly in the city. Instead of comparing thousands of lines of C++ manually, the Code Diff view gives you an immediate visual picture of what changed:
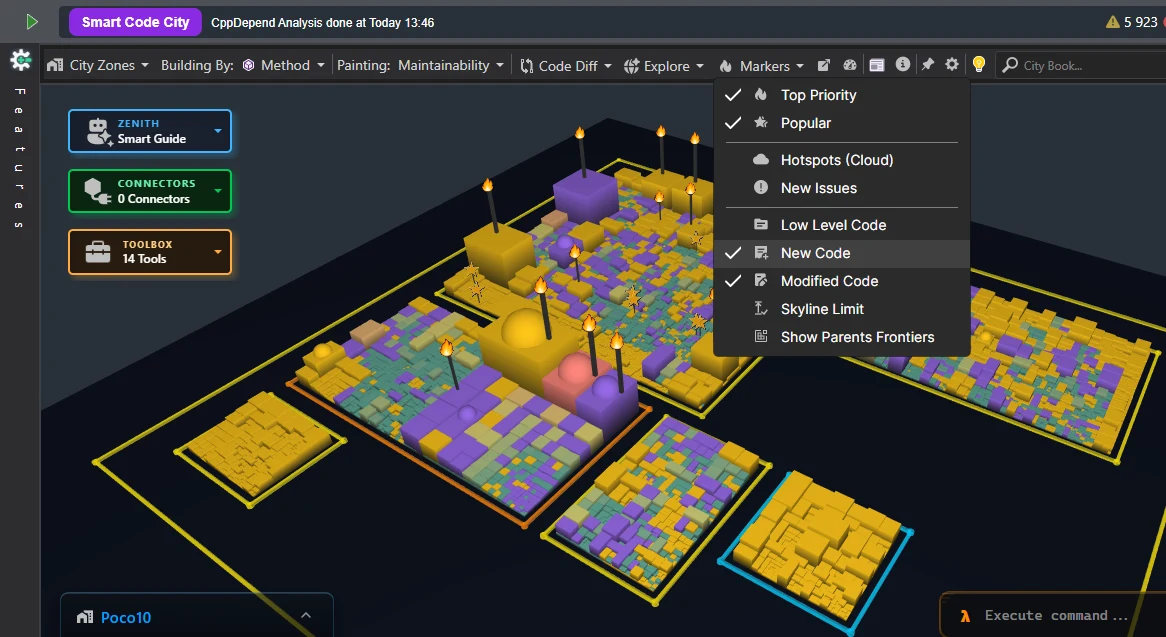
🟨 Gold = New code 🟪 Purple = Modified code
This makes it much easier to answer questions like:
- What did the latest AI generation add?
- Which existing components were modified?
- Where is the change concentrated?
- Did the AI touch a small area or reshape large parts of the architecture?
- Which parts of the codebase deserve a closer review?
The result is a much faster way to go from “What changed?” to “Where should I investigate?”. AI can generate the change. CppDepend helps you see the impact.
Go Beyond Code Diff: Visualize Metric Changes in 3D
Code changes aren’t only about which lines were added or modified. The more important question is: how did the change affect the quality and complexity of the codebase?
With advanced metric diff visualization, you can compare the codebase before and after a change and see the impact directly in the 3D Smart Code City:
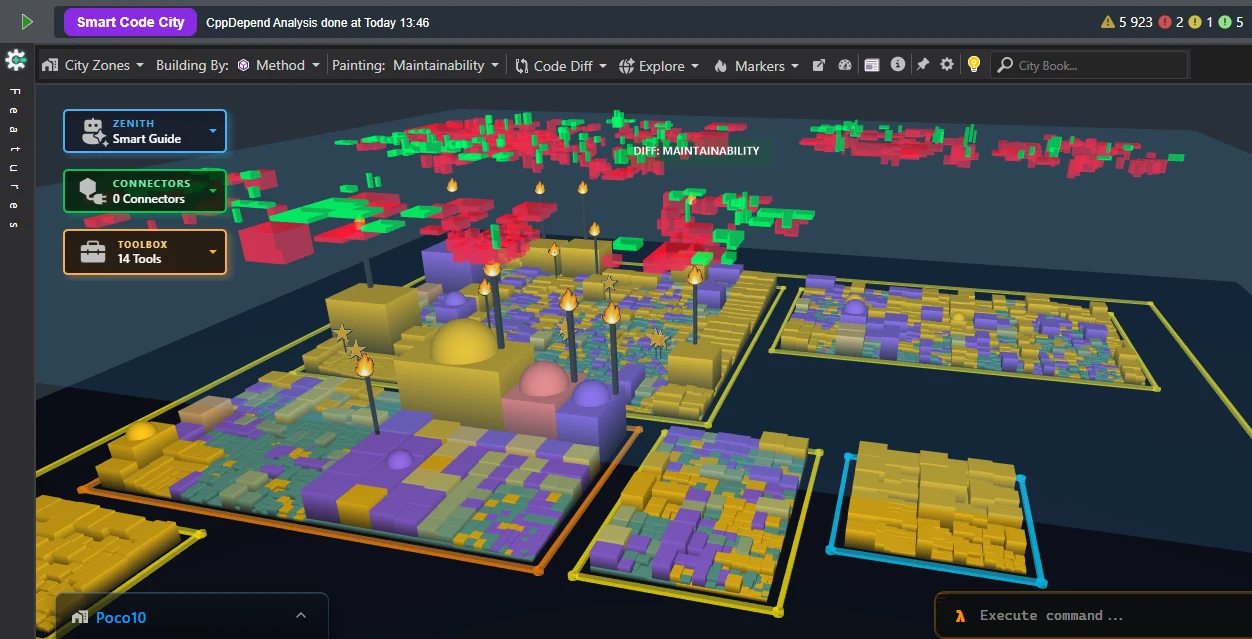
Instead of looking at a spreadsheet of numbers, you can visually explore how metrics evolve across the architecture:
- 3D buildings make metric changes visible.
- Colors highlight areas requiring attention.
- Markers reveal potential hotspots.
- Building dimensions expose changes in complexity and structure.
- The entire architecture provides context for the change.
This is especially interesting for AI-generated C++ code. An AI model may introduce a change that looks small in a diff — but that change could increase complexity, reduce maintainability, or affect a highly connected component. With a 3D metric diff, you can quickly spot those architectural effects.
From line-level diff → to metric-level diff → to architectural impact. That’s the real advantage of visualizing code evolution. Don’t just see what changed — see what the change did to your codebase.
Inspect Any Element: Tooltips, Recommendations & 3D Call Graphs
Smart Code City combines macro architectural views with instant, deep-dive metric inspection for any element in the codebase.
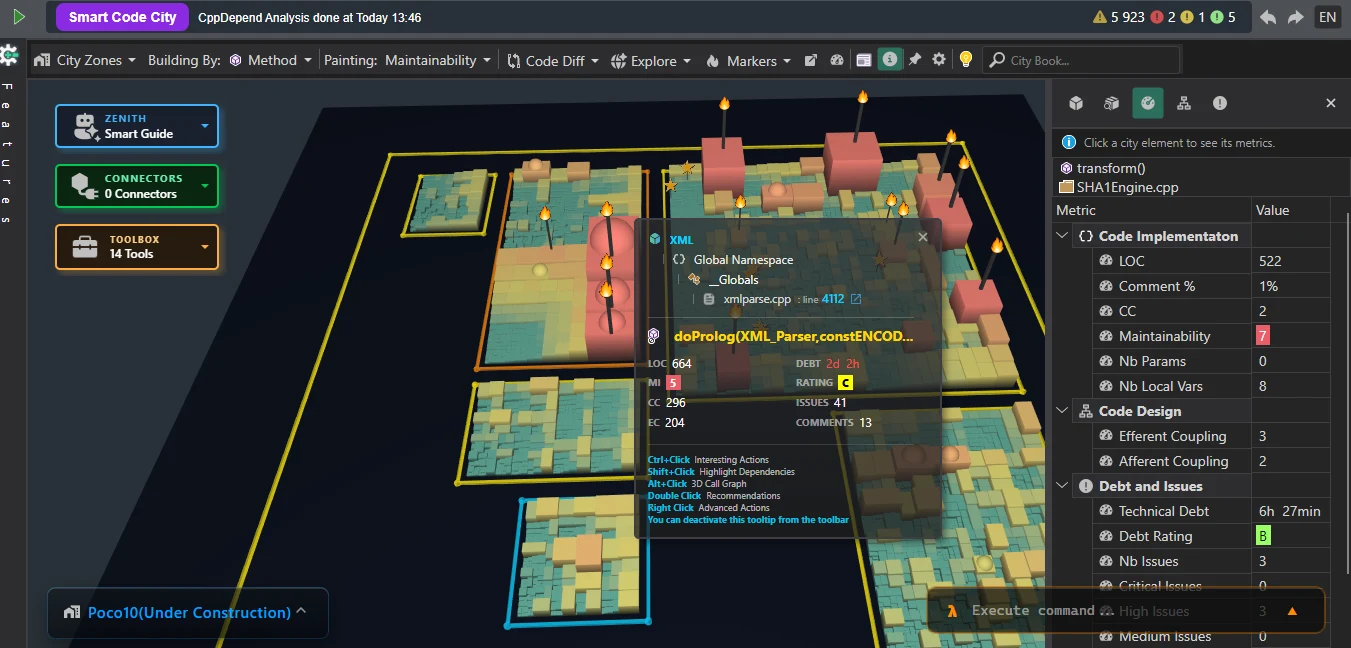
On-Hover Tooltips & Side Metrics Panel
- Location context: full namespace hierarchy, class name, source file (e.g., xmlparse.cpp), and exact line number.
- Key metrics at a glance: Lines of Code, Maintainability Index, cyclomatic complexity, efferent/afferent coupling, technical debt estimation, debt rating, total issues, and comment count.
- Quick interactive shortcuts: Ctrl+Click (actions), Shift+Click (dependencies), Alt+Click (3D call graph), double-click (recommendations), right-click (advanced actions).
- Side metrics panel: clicking a building anchors a detailed breakdown categorized across Code Implementation, Code Design, and Debt & Issues.
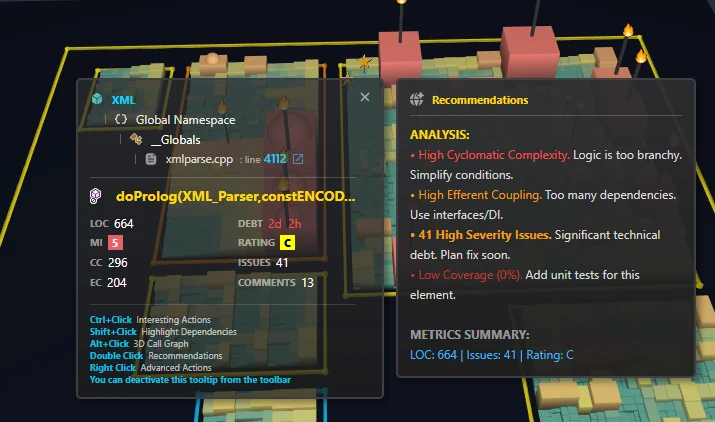
Double-Click: Actionable Recommendations
Double-clicking any building triggers an instant Recommendations panel that translates complex static analysis numbers into clear, prioritized advice:
- High cyclomatic complexity: highlights branchy logic and recommends simplifying conditional structures.
- High efferent coupling: identifies excessive outgoing dependencies and advises introducing interfaces or Dependency Injection.
- Issue alerts: pinpoints high-severity issues (e.g., 41 High Severity Issues) and flags significant technical debt requiring immediate planning.
- Test coverage warnings: flags unmonitored code (e.g., Low Coverage 0%) and prompts adding unit tests.
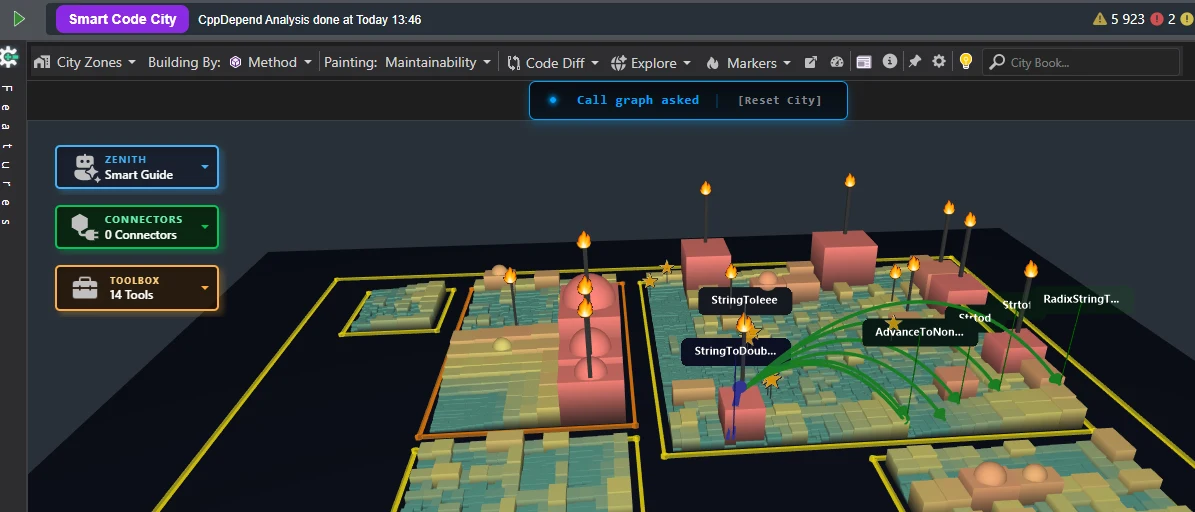
Alt+Click: Interactive 3D Call Graphs
- Instant call graph tracing: holding Alt and clicking any building renders 3D directional arcs connecting the selected element directly to all callers and callees across the cityscape.
- Spatial relationship mapping: green directional arrows visually trace execution paths between methods in real time, exposing how a single function interacts with neighboring districts or distant modules.
- Contextual method labels: targeted callees are labeled directly, making call chains intuitive to traverse without leaving the 3D view.
Explore Like a Pro: City Zones, The Code News & the Command Line
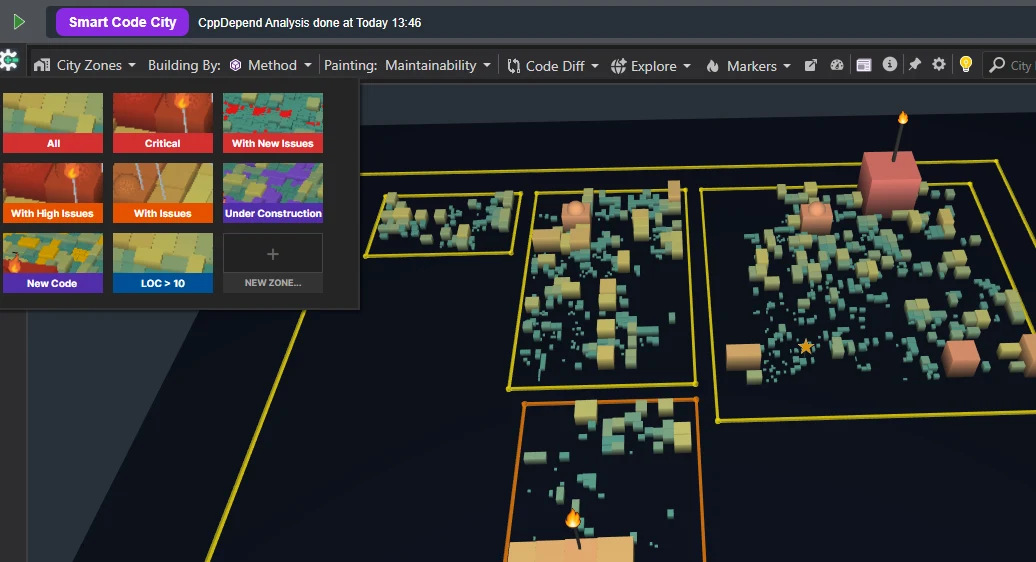
City Zones & Scope Isolation
A powerful City Zones filtering system lets teams filter out noise and focus exclusively on specific sub-scopes of the codebase:
- Critical: only elements triggering critical architectural or safety rule violations.
- With New Issues: regressions and new violations introduced in recent commits.
- With High Issues / With Issues: methods with active technical debt.
- New Code: newly added components, to verify modern code quality during reviews.
- Under Construction: actively modified areas undergoing refactoring or expansion.
- Custom size thresholds (e.g., LOC > 10): focus on non-trivial methods while hiding small helpers.
- Custom zone creation (+ NEW ZONE…): define spatial views tailored to team workflows or sprint objectives.
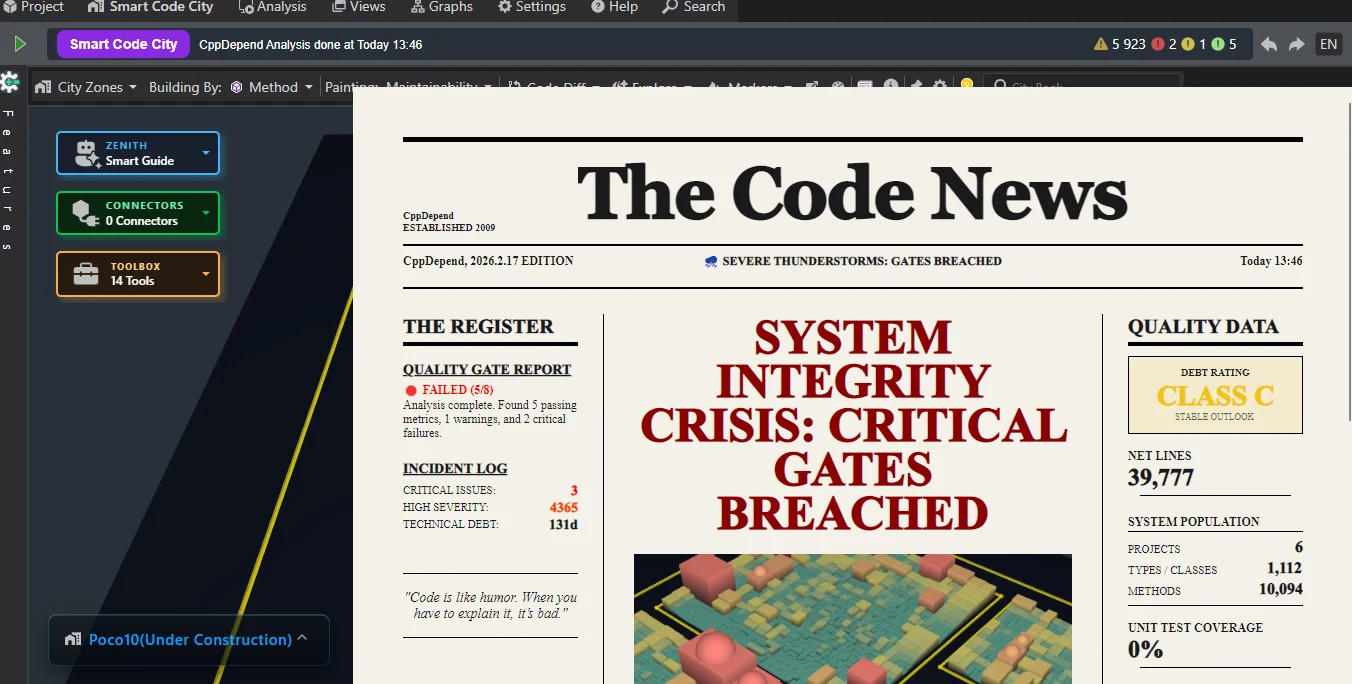
The Code News: Editorial-Style Quality Reporting
Smart Code City transforms dry static analysis data into an engaging, newspaper-style executive summary:
- Front-page headlines: instantly broadcast the current health status of your build — such as “SYSTEM INTEGRITY CRISIS: CRITICAL GATES BREACHED” when quality thresholds fail.
- The Register (incident log): a quick dispatch of build health, summarizing quality gate reports (e.g., FAILED 5/8), critical issues, high-severity violations, and total technical debt days.
- At-a-glance quality data: debt rating with outlook (e.g., Class C / Stable Outlook), net lines of code, system population (projects, types, methods), and unit test coverage.
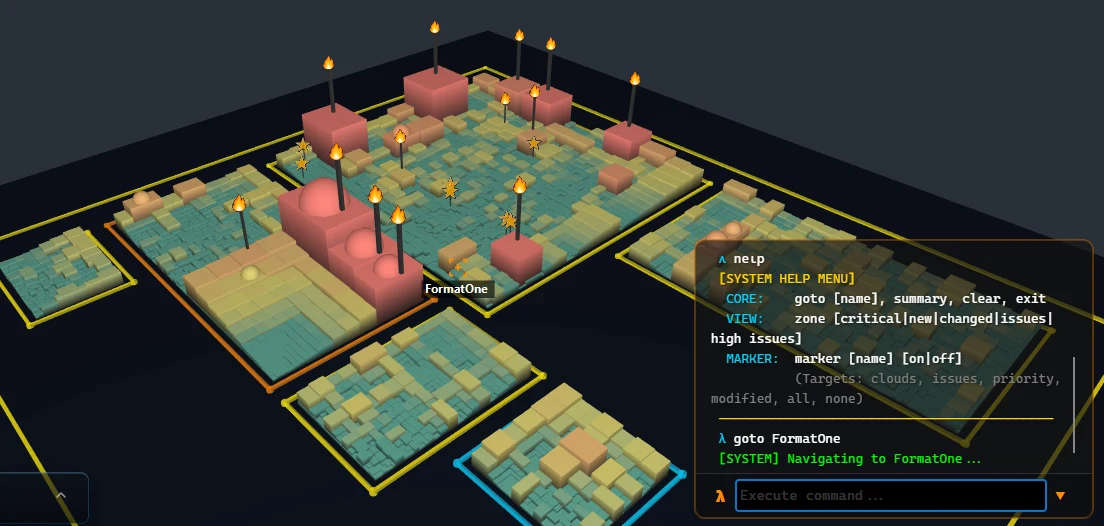
The City Command Line (λ)
A terminal-style command interface (λ Execute command…) allows keyboard-driven navigation and real-time visualization manipulation:
goto [name]: instantly centers and zooms the camera onto a specific building, method, or class.summary: generates a high-level architectural overview of the current selection or view.zone [critical | new | changed | issues | high issues]: dynamically applies spatial filters without opening menus.marker [name] [on|off]: controls visual overlays (clouds, issues, priority, modified, all, none).clear / exit: resets highlights or closes the terminal overlay.
Conclusion: A Picture Is Worth a Thousand Lines of Code
As C++ architectures expand — and as AI-augmented workflows generate code faster than ever — traditional text-based reports and endless compiler logs no longer suffice to maintain control over software quality. Smart Code City transforms complex static code analysis into an intuitive 3D spatial landscape where architectural health, technical debt, and structural risk become instantly recognizable.
A single visual inspection of the cityscape replaces hours of manual code auditing:
- Instant risk detection: oversized buildings, cluster density, and warning markers reveal technical debt, excessive complexity, and architectural drift at a glance.
- Interactive architectural control: from custom CQLinq queries and 3D call graphs to keyboard-driven terminal commands, developers can inspect execution paths and isolate high-risk zones effortlessly.
- Actionable guidance: embedded tooltips, double-click refactoring recommendations, and executive summaries convert raw data into clear, prioritized engineering tasks.
By bringing spatial awareness to C++ static analysis, CppDepend proves that a single 3D visualization is truly worth a thousand lines of code — ensuring rapid feature development never comes at the cost of long-term maintainability, safety, or system integrity.